Interactive Data Visualization: Animating the viewBox
Controlling the way that a data visualization lays out on your page on the fly is powerful in terms of conveying information. In the past, we’ve talked about how we can use this to hide and show information for responsive development. When working with SVG, we can do this by using the viewBox as a camera, isolating the relevant information on the page to highlight information for the viewer. There are so many uses for this technique. We’re going to be looking at a new way of working with it dynamically to get the processor to do the heavy lifting for us.
Before we go into animating the viewBox, we should cover what the viewBox in SVG is. I’m just going to cover the basics here, but if you want to deep dive, there are some great articles to help with that.
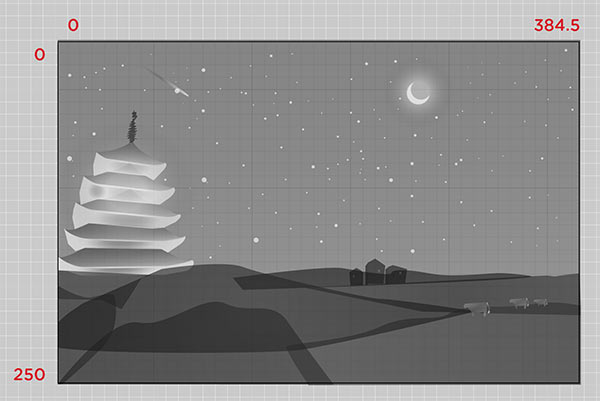
The viewBox acts as a window in which you see in to your SVG. It’s defined with 4 coordinate values: min-x, min-y, width, and height. If the graphic below, you can see the full drawing:
The black box around it is defining the viewBox. If you’re familiar with Illustrator, this is the “artboard”. You can change up the artboard in Illustrator by going to File > Document Setup > Edit Artboards. You can then crop your image on the fly and change the visible area. If you know that your graphic is exactly the size of your desired viewBox, you can quickly do so with Object > Artboards > Fit to Artwork Bounds.
See the Pen showing the full viewBox by Sarah Drasner (@sdras) on CodePen.
When we keep the viewBox the same, and we can change the width and height of the SVG:
See the Pen showing the full viewBox by Sarah Drasner (@sdras) on CodePen.
You can think about it a little like the SVG DOM is plotting itself along a grid. That grid can shrink and grow but the aspect ratio of the grid stays consistent. Here we have the SVG plotted at 0 min of the x axis of the grid and 0 min of the y. The width expands across by 384.5 and the height by 250, roughly.

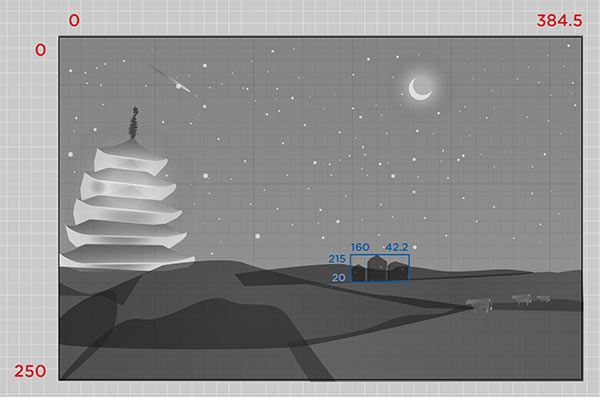
If we group those houses together, we can see where they lie as well:

We can crop the whole visible area to just the houses by changing the viewBox to "215 160 42.2 20"
In order to find the viewBox coordinates for that group, we could do some measuring, editing by hand, but that’s pretty arduous and because the viewBox is scalable, gets tricky. Luckily for us, there’s a native method we can use called getBBox(). This returns the bounding box at the time that the method is called, and is exclusive of stroke, masking or filter effects. It returns an SVGRect object at the time that it’s called (even if it hasn’t yet been rendered).
The cool thing about the SVGRect object is that it returns four values. The x-min, y-min, width, and height. Sounds a bit familiar, huh?

This is really handy for us because in order to update the viewBox dynamically, all we have to do is we store the values from the object as our new viewBox string like so var newView = "" + s.x + " " + s.y + " " + s.width + " " + s.height;
We can then set the new viewBox string as the viewBox attribute on the SVG: foo.setAttribute("viewBox", newView);
See the Pen showing the full viewBox by Sarah Drasner (@sdras) on CodePen.
Now we’re cooking with gas.
To animate to the new viewBox values, we have a few options, all using JavaScript (for the time being):
- We can use requestAnimationFrame with a polyfill to update the value of our coordinates over time.
- We can use GreenSock’s attr plugin (comes already bundled in with the typical default library of TweenMax) to animate it.
The cool thing about GreenSock is it can animate any two integers, so it’s a pretty nice tool for this. I’m going to use GreenSock in the following example because there are a number of other things I want to animate, and I’d like quick finite control of my easing values. But either method works well.
One quick thing to keep in mind is that SVGRect will always return a rectangle, even if the element in question is not one, and there are no diagonals, even when it’s transformed. Here’s a quick demo of some rotating shapes with a stroke applied so that you can see what I mean:
See the Pen Showing what happens to the Bounding Box when an SVG Element is rotated by Sarah Drasner (@sdras) on CodePen.
In the following example I have a map, and when the user interacts with it, I want to give more information on the specific country they select.
See the Pen Animated viewBox Data Visualization by Sarah Drasner (@sdras) on CodePen.
I have a repeated animation for the hotspots. I’m also using some simple data attributes on the elements themselves so that I can store and use that information to animate. Consistent naming is important here – it’s how I’m controlling which country is expanded and what details are shown.
<g data-name="usa" class="hotspot">
  <circle id="dot2" cx="221" cy="249" r="2.4" fill="url(#radial-gradient)"/>
  <circle id="dot1" cx="221" cy="249" r="2.4" fill="url(#radial-gradient)"/>
  <circle id="dotmid" cx="221" cy="249" r="2.3" fill="#45c6db"/>
</g>
I’ve also added some extra padding to the hotspot elements so that their click target is large enough for mobile devices and our fingers
.hotspot {
  cursor: pointer;
  /* make the hit targets bigger for mobile */
  padding: 20px;
}
I can then write a function that, on click, passes in the data attribute and updates the viewBox based on the shape of the country. I’ve added 200 to the width to accommodate for the text beside the country.
// interaction
function zoomIn(country) {
// zooming in part
var currentCountry = document.getElementById(country),
    s = currentCountry.getBBox(),
    newView = "" + s.x + " " + s.y + " " + (s.width + 200) + " " + s.height,
    group1 = [".text-" + country, ".x-out"],
    tl = new TimelineMax();

    tl.add("zIn");
    tl.fromTo(map, 1.5, {
      attr: { viewBox: "0 0 1795.2 875.1"}
    }, {
      attr: { viewBox: newView }
    }, "zIn");
    tl.to(".text-" + country, 0.1, {
      display: "block"
    }, "zIn");
    tl.fromTo(group2, 0.25, {
      opacity: 1
    }, {
      opacity: 0,
      ease: Circ.easeIn
    }, "zIn");
    tl.fromTo(currentCountry, 0.35, {
      opacity: 0
    }, {
      opacity: 1,
      ease: Circ.easeOut
    }, "zIn+=0.5");
    tl.fromTo(group1, 0.5, {
      opacity: 0
    }, {
      opacity: 0.65,
      ease: Sine.easeOut
    }, "zIn+=1");
}

$(".hotspot").on("click", function() {
  var area = this.getAttribute('data-name');
  $(".x-out").attr("data-info", area);
  zoomIn(area);
});
If I wanted my code to be super slim, I could have wrapped the timeline in a function and simply reversed it when someone clicked the x-out, but when I tried that, the animation was just a little sloppier than I liked, so I created a new function to refine the timing a little. I could also have used tl.to instead of fromTo, but I’ve found that when restarting animations, offering an initial value in fromTo helps to stabilize it a bit (particularly if you don’t know who might be updating your code).
viewBox in CSS?
There was a proposal by Jake Archibald to promote the viewBox as a CSS property, which I heavily support. If you want to support it, too, please either add a comment with technical feedback or add a thumbs up to one of the existing comments (to avoid crowding the main thread). A CSS property to control the viewBox would be wonderful because we could easily apply media queries and animation, perhaps even reducing the layout triggers and repaints for such updates.
Another Demo: A Guided Infographic
For extra fun, I made a small flowchart to show how this technique can be used to guide users. This particular chart guides users toward choosing the right image format for the job.
See the Pen Animated Flow Chart 3 by Sarah Drasner (@sdras) on CodePen.
Animation warning: It’s potentially dizzying, so don’t play with it if you have a vestibular disorder. If I embedded this on a production site I might have a toggle to turn the animation off or a fallback to a simplified questionnaire.
Other Explorations
There are other people working with the idea of animating the viewBox as well. Louis Hoebregts wrote a great post on it, and David Bachmann Johannesson made this slim and awesome Pen, among others.
Seen others? Link us up in the comments.
Interactive Data Visualization: Animating the viewBox is a post from CSS-Tricks
