How We Used WebAssembly To Speed Up Our Web App By 20X (Case Study)
How We Used WebAssembly To Speed Up Our Web App By 20X (Case Study)
Robert Aboukhalil2019-04-05T12:00:29+02:002019-04-05T11:29:44+00:00
If you haven’t heard, here’s the TL;DR: WebAssembly is a new language that runs in the browser alongside JavaScript. Yes, that’s right. JavaScript is no longer the only language that runs in the browser!
But beyond just being “not JavaScript”, its distinguishing factor is that you can compile code from languages such as C/C++/Rust (and more!) to WebAssembly and run them in the browser. Because WebAssembly is statically typed, uses a linear memory, and is stored in a compact binary format, it is also very fast, and could eventually allow us to run code at “near-native” speeds, i.e. at speeds close to what you’d get by running the binary on the command line. The ability to leverage existing tools and libraries for use in the browser and the associated potential for speedup, are two reasons that make WebAssembly so compelling for the web.
So far, WebAssembly has been used for all sorts of applications, ranging from gaming (e.g. Doom 3), to porting desktop applications to the web (e.g. Autocad and Figma). It is even used outside the browser, for example as an efficient and flexible language for serverless computing.
This article is a case study on using WebAssembly to speed up a data analysis web tool. To that end, we’ll take an existing tool written in C that performs the same computations, compile it to WebAssembly, and use it to replace slow JavaScript calculations.
Note: This article delves into some advanced topics such as compiling C code, but don’t worry if you don’t have experience with that; you will still be able to follow along and get a sense for what is possible with WebAssembly.
Background
The web app we will work with is fastq.bio, an interactive web tool that provides scientists with a quick preview of the quality of their DNA sequencing data; sequencing is the process by which we read the “letters” (i.e. nucleotides) in a DNA sample.
Here’s a screenshot of the application in action:
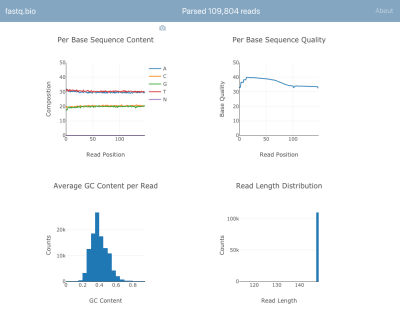
We won’t go into the details of the calculations, but in a nutshell, the plots above provide scientists a sense for how well the sequencing went and are used to identify data quality issues at a glance.
Although there are dozens of command line tools available to generate such quality control reports, the goal of fastq.bio is to give an interactive preview of data quality without leaving the browser. This is especially useful for scientists who are not comfortable with the command line.
The input to the app is a plain-text file that is output by the sequencing instrument and contains a list of DNA sequences and a quality score for each nucleotide in the DNA sequences. The format of that file is known as “FASTQ”, hence the name fastq.bio.
If you’re curious about the FASTQ format (not necessary to understand this article), check out the Wikipedia page for FASTQ. (Warning: The FASTQ file format is known in the field to induce facepalms.)
fastq.bio: The JavaScript Implementation
In the original version of fastq.bio, the user starts by selecting a FASTQ file from their computer. With the File object, the app reads a small chunk of data starting at a random byte position (using the FileReader API). In that chunk of data, we use JavaScript to perform basic string manipulations and calculate relevant metrics. One such metric helps us track how many A’s, C’s, G’s and T’s we typically see at each position along a DNA fragment.
Once the metrics are calculated for that chunk of data, we plot the results interactively with Plotly.js, and move on to the next chunk in the file. The reason for processing the file in small chunks is simply to improve the user experience: processing the whole file at once would take too long, because FASTQ files are generally in the hundreds of gigabytes. We found that a chunk size between 0.5 MB and 1 MB would make the application more seamless and would return information to the user more quickly, but this number will vary depending on the details of your application and how heavy the computations are.
The architecture of our original JavaScript implementation was fairly straightforward:
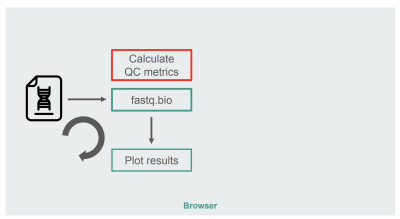
The box in red is where we do the string manipulations to generate the metrics. That box is the more compute-intensive part of the application, which naturally made it a good candidate for runtime optimization with WebAssembly.
fastq.bio: The WebAssembly Implementation
To explore whether we could leverage WebAssembly to speed up our web app, we searched for an off-the-shelf tool that calculates QC metrics on FASTQ files. Specifically, we sought a tool written in C/C++/Rust so that it was amenable to porting to WebAssembly, and one that was already validated and trusted by the scientific community.
After some research, we decided to go with seqtk, a commonly-used, open-source tool written in C that can help us evaluate the quality of sequencing data (and is more generally used to manipulate those data files).
Before we compile to WebAssembly, let’s first consider how we would normally compile seqtk to binary to run it on the command line. According to the Makefile, this is the gcc incantation you need:
# Compile to binary
$ gcc seqtk.c
   -o seqtk
   -O2
   -lm
   -lz
On the other hand, to compile seqtk to WebAssembly, we can use the Emscripten toolchain, which provides drop-in replacements for existing build tools to make working in WebAssembly easier. If you don’t have Emscripten installed, you can download a docker image we prepared on Dockerhub that has the tools you’ll need (you can also install it from scratch, but that usually takes a while):
$ docker pull robertaboukhalil/emsdk:1.38.26
$ docker run -dt --name wasm-seqtk robertaboukhalil/emsdk:1.38.26
Inside the container, we can use the emcc compiler as a replacement for gcc:
# Compile to WebAssembly
$ emcc seqtk.c
    -o seqtk.js
    -O2
    -lm
    -s USE_ZLIB=1
    -s FORCE_FILESYSTEM=1
As you can see, the differences between compiling to binary and WebAssembly are minimal:
- Instead of the output being the binary file
seqtk, we ask Emscripten to generate a.wasmand a.jsthat handles instantiation of our WebAssembly module - To support the zlib library, we use the flag
USE_ZLIB; zlib is so common that it’s already been ported to WebAssembly, and Emscripten will include it for us in our project - We enable Emscripten’s virtual file system, which is a POSIX-like file system (source code here), except it runs in RAM within the browser and disappears when you refresh the page (unless you save its state in the browser using IndexedDB, but that’s for another article).
Why a virtual file system? To answer that, let’s compare how we would call seqtk on the command line vs. using JavaScript to call the compiled WebAssembly module:
# On the command line
$ ./seqtk fqchk data.fastq

# In the browser console
> Module.callMain(["fqchk", "data.fastq"])
Having access to a virtual file system is powerful because it means we don’t have to rewrite seqtk to handle string inputs instead of file paths. We can mount a chunk of data as the file data.fastq on the virtual file system and simply call seqtk’s main() function on it.
With seqtk compiled to WebAssembly, here’s the new fastq.bio architecture:
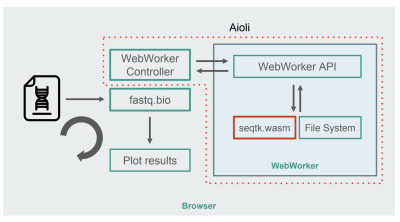
As shown in the diagram, instead of running the calculations in the browser’s main thread, we make use of WebWorkers, which allow us to run our calculations in a background thread, and avoid negatively affecting the responsiveness of the browser. Specifically, the WebWorker controller launches the Worker and manages communication with the main thread. On the Worker’s side, an API executes the requests it receives.
We can then ask the Worker to run a seqtk command on the file we just mounted. When seqtk finishes running, the Worker sends the result back to the main thread via a Promise. Once it receives the message, the main thread uses the resulting output to update the charts. Similar to the JavaScript version, we process the files in chunks and update the visualizations at each iteration.
Performance Optimization
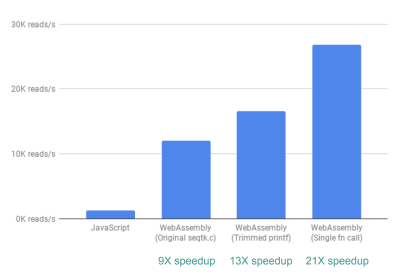
To evaluate whether using WebAssembly did any good, we compare the JavaScript and WebAssembly implementations using the metric of how many reads we can process per second. We ignore the time it takes for generating interactive graphs, since both implementations use JavaScript for that purpose.
Out of the box, we already see a ~9X speedup:
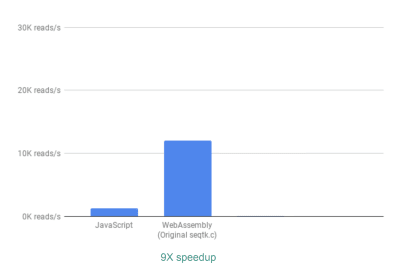
This is already very good, given that it was relatively easy to achieve (that is once you understand WebAssembly!).
Next, we noticed that although seqtk outputs a lot of generally useful QC metrics, many of these metrics are not actually used or graphed by our app. By removing some of the output for the metrics we didn’t need, we were able to see an even greater speedup of 13X:
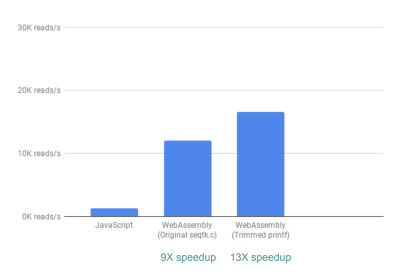
This again is a great improvement given how easy it was to achieve—by literally commenting out printf statements that were not needed.
Finally, there is one more improvement we looked into. So far, the way fastq.bio obtains the metrics of interest is by calling two different C functions, each of which calculates a different set of metrics. Specifically, one function returns information in the form of a histogram (i.e. a list of values that we bin into ranges), whereas the other function returns information as a function of DNA sequence position. Unfortunately, this means that the same chunk of file is read twice, which is unnecessary.
So we merged the code for the two functions into one—albeit messy—function (without even having to brush up on my C!). Since the two outputs have different numbers of columns, we did some wrangling on the JavaScript side to disentangle the two. But it was worth it: doing so allowed us to achieve a >20X speedup!
A Word Of Caution
Now would be a good time for a caveat. Don’t expect to always get a 20X speedup when you use WebAssembly. You might only get a 2X speedup or a 20% speedup. Or you may get a slow down if you load very large files in memory, or require a lot of communication between the WebAssembly and the JavaScript.
Conclusion
In short, we’ve seen that replacing slow JavaScript computations with calls to compiled WebAssembly can lead to significant speedups. Since the code needed for those computations already existed in C, we got the added benefit of reusing a trusted tool. As we also touched upon, WebAssembly won’t always be the right tool for the job (gasp!), so use it wisely.
Further Reading
- “Level Up With WebAssembly,” Robert Aboukhalil
A practical guide to building WebAssembly applications. - Aioli (on GitHub)
A framework for building fast genomics web tools. - fastq.bio source code (on GitHub)
An interactive web tool for quality control of DNA sequencing data. - “An Abridged Cartoon Introduction To WebAssembly,” Lin Clark