Archive

Archive for December, 2019

Smashing Monthly Roundup: What’s New?

December 20th, 2019 No comments
Advent calendars

Smashing Monthly Roundup: What’s New?

Smashing Monthly Roundup: What’s New?

Iris Lješnjanin

2019-12-20T14:00:00+00:002019-12-22T03:36:06+00:00

With the year slowly coming to an end, now is probably a great time to slow down and be mindful. Look back, reflect, breathe. It’s been a long year for all of us, so why not make yourself a good cuppa coffee or tea (whatever your preference is, there are other options, of course), and think about what your personal highlights were and set out some hopes and goals for the upcoming year to come.

We enjoyed counting down the days of 2019 with a good number of creative advent calendars that were brought to life by some quite talented folks. Some are publishing traditional articles while others have thought of a challenge for each day of the month of December. You can follow the lovely projects via their RSS feeds (if available) and Twitter accounts to make it easy for you to keep track of your favorites.

With the holidays coming up, why not get yourself cozy and catch up with a few talks? We have a whole lot of videos that you may like watching and listening to:

Sara Soueidan presented a talk on Applied Accessibility in SmashingConf NYC, and Marcy Sutton spoke about Garbage Components. In case you’d like to follow along more closely, you’ll find the talk slides and some helpful links on the SmashingConf website, as well as some lovely snapshots of the event.

If you’re already planning which events to attend next year, we have an oveview of upcoming conferences around the globe that you may want to check out, and if you’re eager not to miss out on one of our SmashingConfs, then super early-bird SmashingConf tickets are already available! Just sayin’! ?

What’s New At Smashing?

Smashing Podcast moderated by Drew McLellanIn case you missed it, we launched the Smashing Podcast just a few weeks ago — a bi-weekly podcast that is moderated by our dear friend and colleague, Drew McLellan. There are already 5 podcasts to listen to, so join him as he chats to Jina Anne about design tokens, Heydon Pickering on inclusive components, and Jason Pamental on all things variable fonts. You can subscribe and tune into any podcast player of your choice!

Inclusive Components book cover

Also, we officially released the “Inclusive Components” book, and the response has been overwhelmingly positive! Ari Stiles collected some of the book reviews we’ve received so far, with more coming in each day! Grab your own copy of Heydon’s book, and let us know what you think — we’d love to hear from you!

Trending Articles On Smashing Magazine

We publish a new article every day, and so if you’re not subscribed to our RSS feed or follow us on social media, you may miss out on some brilliant articles! Here are some that our readers seemed to enjoy and recommend further:

Best Picks From Our Newsletter

We’ll be honest: Every second week, we struggle with keeping the Smashing Newsletter issues at a moderate length — there are just so many talented folks out there working on brilliant projects! So, without wanting to make this monthly update too long either, we’re shining the spotlight on the following projects:

Note: A thank you to Cosima Mielke for writing and preparing these posts!

Web Almanac 2019

Take data processed from nearly 6 million websites and 85 people volunteering countless hours planning, researching, and writing — that’s what it took to create the 2019 edition of the Web Almanac, HTTP Archive’s annual state of the web report.

Illustration showing little characters made up of geometrical forms painting a website.

(Source)

The report consists of 20 chapters spanning aspects of page content, user experience, publishing, and distribution to shine a light on the current state of the ever-evolving network of technology that the open web is. A great resource to become more aware of current best practices.

How To Read A WebPage Test Waterfall Chart

Do you have difficulties reading WebPageTest waterfall charts? You’re not alone, it can be quite a challenge to remember the details and what they all mean. To freshen up your knowledge, Matt Hobbs collected all the many bits of information in a single blog post that we all can refer to.
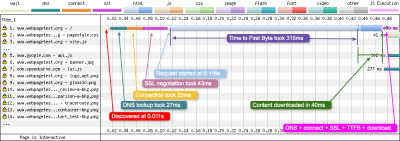
WebPageTest timeline and chart

(Source)

The post explains the basic layout of the waterfall chart, what each of the colored vertical lines means, and what metrics the horizontal blocks refer to. It also lists common patterns that you might stumble upon in a waterfall chart. One for the bookmarks.

Open-Source Illustrations Kit

100-day challenges are a wonderful opportunity to dive deep into a topic or craft and evolve and improve with each day. Back in 2016, Vijay Verma spent almost two hours a day for 100 days designing, illustrating, and experimenting to get himself to the next level of illustration.

A screenshot of open-source illustrations available

(Source)

After living on a harddrive untouched since then, Vijay now decided to release the illustrations as a free open-source illustrations kit so you can use them for your landing pages, mobile apps, presentations, or whatever else comes to your mind. Available in AI, SVG, PNG, and EPS formats. Thank you, Vijay, for sharing!

30 Days Of Code Tidbits

Who doesn’t love a bite-sized tip? One that doesn’t take long to swallow but teaches you something new to instantly ease your life as a developer? Using the hashtag #codetidbits30 on Twitter, Samantha Ming posts a new coding tidbit every day in December.

Code tidbit explaining how to merge arrays

(Source)

Three ways to remove array duplicates, a little trick to style elements that have no children or text at all, and a solution for displaying your data in your browser dev tools, these are only some of the tips in the series. Covering JavaScript, HTML, and CSS snippets, #codetidbits30 is a true treasure chest of front-end goodies. Be sure to follow along.

Scaling SVGs Made Simple

Scaling elements can be a daunting task, since they act very differently than normal images. Amelia Wattenberger came up with an ingenious comparison to help us make sense of SVGs and their special features: “The element is a telescope into another world.”

A person looking through a telescope watching a star shape

(Source)

Based on the idea of the telescope, Amelia explains how to use the viewBox property to zoom in or out with your “telescope”, and, thus, change the size of your . A small tip that works wonders.

Recreating Print Layouts With CSS

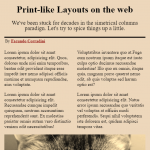
When it comes to creative layouts, magazines are an endless source of inspiration. And thanks to CSS Grid, there’s nothing to hold you back from bringing more sophisticated layouts to the web, too.

Layout for an article abou the Dutch soccer player Virgil Van Dijk

(Source)

Inspired by magazine layouts, their use of typography and their structures, Dan Davies took on the challenge to recreate some of the print work he liked on the web. The result is an awe-inspiring collection of nine layouts that use the potential of CSS Grid to its fullest. Beautifully art-directed and responsive, they are great examples of pushing the limits of what’s possible on the web layout-wise.

Web Performance Vs. User Engagement

It’s no secret that performance can have a positive impact on user engagement and, in effect, improve conversion. To find out how performance correlates to conversion for their product, the team at Vrbo implemented an automated process that shows the connection between business events and performance data.
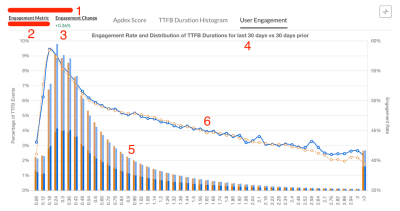
A screenshot of the holy grail dashboard created at Vrbo

(Source)

Carlos Moro from Vrbo now shares a case study in which he gives more insights into the approach, as well as handy tips for measuring site performance, user engagement, and putting the two into relation to one another. Interesting.

Time-Travel-Debugging For The Web

An early Firefox DevTools experiment that is worth keeping an eye on is Web Replay. Web Replay records your actions so you can track bugs down faster and understand your code better — a collaborative time-travel debugging instrument, so to say.
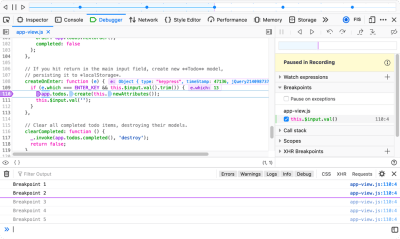
Replay in Firefox DevTools

(Source)

The replaying process preserves all the same JS behavior, DOM structures, graphical updates, and most other behavior that occurred while recording. Want to give it a try? Replay is already available in Firefox Nightly for macOS (still disabled by default until it is more stable, but you can turn it on manually). Handy!

Commit-Message-Driven Development

Have you ever considered to write the commit message before you start writing the code? Sven Hofmann does it this way, and now he explains why you could give it a try, too.

Bash functions incorporating commit-message-driven development into a developer's workflow.

(Source)

We all know those vague and messy commit messages like “bugfixes and minor improvements” that aren’t helpful in the long term — especially if you’re working with a team or on an open-source project. The commit-message-driven workflow that Sven suggests could help change that: first, you write the commit message, then the code, then you commit. Having the scope of the task nailed down in advance, gives each commit a precise goal that you can focus on and that makes it easier to review your commits later on. Clever!

Dealing With Ads In 2020

Ads are a two-sided sword: nobody really likes them but a lot of sites depend on them to generate revenue. Working for a news company that is dependent on ads, Christian Schaefer wanted to find ways to minimize their impact and make them less annoying. Now he summarized his approach in a comprehensive blog post.

Screenshot from the “Dealing with Ads in 2020” blog post

(Source)

The post shares valuable insights into how Christian and his team developed a generic solution to transform and combine mobile and desktop ad code into one responsive ad loading code, how they improved performance by lazy loading the ads, what they did to prevent the ads from breaking the site’s layout, and some other things that add up to bringing the front end into a much better position when dealing with ads. Great tips for everyone who finds themselves wrangling ads.

If you don’t get our newsletter yet, then sign up here to receive useful techniques and goodies (including a free eBook on accessibility)!

From Smashing With Love

A month can be a long time to stay on top of things, so please do subscribe to our bi-weekly newsletter and our podcast if you still haven’t. Each and every issue is written and edited with love and care. No third-party mailings or hidden advertising — promise!

You can also tune into our very own Smashing TV, and follow us on Twitter, Facebook as well as LinkedIn. Please do always feel free to reach out and share your projects with us! We love hearing from you!

On behalf of the entire team, we wish you all the best for 2020! Stay smashing! ?

Smashing Editorial(cm, vf, ra, il)
Categories: Others Tags:

6 Tips for Writing Content Regularly

December 20th, 2019 No comments

Okay, you need three to five new ideas for articles, all on the same general topic. Go…

Now here’s where we separate the people who have to come up with regular content all the time from the people who don’t. The people who have things they want to write about but can never get around to it can probably start listing ideas off the top of their head. The people who have to do this for a living, or at least as a part of their job, just groaned in mock agony.

Generating new ideas regularly can be rough, whether you’re doing it for blog posts, social media posts, videos, memes, newsletters, art, or anything else you can imagine. Waiting for inspiration to strike is, for the most part, a sucker’s game. If you want that lightning, you’re going to have to make like a scientist and shoot off a few rockets, metaphorically speaking.

1. Make it Your Livelihood

Okay, this is the nuclear option. You probably shouldn’t start here. But, I’d be remiss if I didn’t talk about just how fast your brain can work when you don’t have a choice. When your rent is on the line, you’ve got a special kind of motivation to pump out ideas. You start to consider ideas you might have passed up as “too weird”, or “too boring” before.

Then you find a way to make those articles work. And you find new ways to come up with ideas. You find yourself doing some of your best—and sometimes worst—work in the middle of the night, because that’s when things finally clicked.

2. Dedicate Some Time to Idea Generation

Looking for new ideas is a mindset, not just something you do. Some people are in this state of mind at all times, every day. For those of us who aren’t Elon Musk, it takes a bit more scheduling.

Set aside some time to look for new ideas: Search the Internet; see what other people have been writing about; stop and ask yourself questions like, “What most interests me about my chosen theme, these days?”. Put yourself in an inquisitive, creative mindset.

Now, you may or may not come up with all of the ideas you need in one sitting. However, dedicating some time to getting your brain in gear can help you come up with new ideas throughout the next day or so. Then you just come back and write them down as soon as you can. Having a note taking app on your phone can help with this.

3. Write From the Heart

As a writer, as a reader, and occasionally as an editor, I prefer articles with passion in them. It’s far more entertaining to read articles by people who clearly feel strongly about their chosen topic. Sure, those strong feelings can lead to biased opinions, but I like it better when they actually have opinions. Writing, or vlogging, meme-ing, or whatever, about topics that get your brain moving at full speed is a good way to make great content.

That’s not to say that you can’t write about things that are less interesting to you, or that you don’t have a lot of experience with. If it’s your job, you might have to. This is where thorough research will save your rear end. But ideally, write what you know and love.

4. Follow the Trends From a Distance

Okay, trends can always give you something to write about. However, don’t just repeat what other people have said. Try to add something new to the conversation. Reference what others have to say on the subject, and add your own insights. Or come at the subject from a completely different angle.

Wait for other people to have the knee-jerk reactions, and write the hot takes. It’s probable that other people will always do this faster than you, so be patient. Take advantage of others’ immediate reactions and the extra time to build a more nuanced perspective on any given issue.

Of course, the Internet is a big place, and chances are good that you’ll end up saying something rather similar to what everyone else says. That’s kind of inevitable. But it’s worth trying to say something new.

5. Get Off the Internet Once in a While

Some of you best ideas hit you in the shower because that’s what happens when you give your brain a break. Your subconscious mind needs time to make connections, and it often works best when you’re doing other things that don’t require as much concentration. This is why career writers spend half their work day (and maybe longer, if they write fiction) pacing, staring out windows, and making coffee.

Also, talk to people. I know I’ve mentioned this before in other recent articles of mine, but… just talk to them. Whether you’re getting ideas from your conversation with them, or using them as a sounding board, never underestimate the value of a good conversation partner.

6. Never Stop Learning

The more you know, the more you’ll have to say. Learning new things, whether in your industry and chosen writing theme or not, will give you more to talk about. It will broaden your perspective by introducing you to new ways of thinking. As in, learning new things literally changes the way your brain works a little bit, which can lead to new ideas.

Plus, if you can draw parallels between what you’ve learned and the topic you write about, there’s an article idea right there. I mean, I managed to compare cat behavior to principles of UX design not so long ago. There are good ideas out there. Just go looking.

Featured image via Unsplash.

Source

Categories: Designing, Others Tags:

Create a Static Site Using Angular & Scully

December 19th, 2019 No comments

The team at HeroDevs has just released the alpha version of Scully, a static site generator for Angular. That’s right, Angular didn’t have an intuitive way to create JAMstack applications before, but now it’s possible!

Scully uses a node CLI application to run Angular schematics so you don’t have to learn any new language or syntax. You can see your static files in a new dist folder called static alongside your application folder.

To watch the full setup, Tara Manicsic went through the process of setting it up on a Learn with Jason Twitch stream. You can check it out here if you want to get started.

Direct Link to ArticlePermalink

The post Create a Static Site Using Angular & Scully appeared first on CSS-Tricks.

Categories: Designing, Others Tags:

Make a smooth shadow, friend.

December 19th, 2019 No comments

One box-shadow is cool and all, but check out Philipp Brumm’s tool for building out comma-separated multiple box-shadows, which result in a much smoother and more natural look.

This reminds me very much of the idea for easing linear-gradient. In a gradient, this smoothing effect is handled by multiple stops with the position and color eased (sloped) rather than linear (straight). The result is noticeably smoother and a more pleasing look.

See the Pen
smooth box-shadow
by Chris Coyier (@chriscoyier)
on CodePen.

Direct Link to ArticlePermalink

The post Make a smooth shadow, friend. appeared first on CSS-Tricks.

Categories: Designing, Others Tags:

Zenserp

December 19th, 2019 No comments

(This is a sponsored post.)

There are plenty of rank tracking software tools out there that allow you to track the position of your website inside the search results pages (SERP) of search engines for certain key phrases. However, these tools are definitely not enough when you are trying to aggregate search results programmatically.

This is exactly what Zenserp enables you to do: The REST-API lets you to retrieve search engine result pages in JSON-format for search queries of your choice. There are countless use cases where this might be useful. Just to name a few:

Rank tracking of your own website or startup

Check your website’s rankings for your most important keywords on a regular basis and see if your SEO campaigns are actually working. It also allows you to check how your rankings in the SERP vary from country to country.

Building Highly Customized SEO Reports

You are building custom SEO reports for your clients? Then you will need a lot of flexibility when it comes to data aggregation and displaying the aggregated data. Our API is just what you need to build highly customized reports that meet the expectations of your customers

Using SERPs as General Data Point for Data Aggregation

When tweaking around with the search queries, there are plenty of useful and valuable data inside the SERP. Since they come in JSON-format, you can automatically feed into your business processes.

Zenserp offers a free plan with 50 monthly API requests for basic use cases. Paid plans go all the way up to enterprise level to support larger projects with high request levels.

The API supports most modern programming languages and comes along with a search request builder that helps you to get started. Also, Zenserp offers a free consulting service, in case you need any help to integrate the service.

Direct Link to ArticlePermalink

The post Zenserp appeared first on CSS-Tricks.

Categories: Designing, Others Tags:

Quantitative Data Tools For UX Designers

December 19th, 2019 No comments
project folder structure

Quantitative Data Tools For UX Designers

Quantitative Data Tools For UX Designers

Adonis Raduca

2019-12-19T11:30:00+00:002019-12-20T00:09:12+00:00

Many UX designers are somewhat afraid of data, believing it requires deep knowledge of statistics and math. Although that may be true for advanced data science, it is not true for the basic research data analysis required by most UX designers. Since we live in an increasingly data-driven world, basic data literacy is useful for almost any professional — not just UX designers.

Aaron Gitlin, interaction designer at Google, argues that many designers are not yet data-driven:

“While many businesses promote themselves as being data-driven, most designers are driven by instinct, collaboration, and qualitative research methods.”

— Aaron Gitlin, “Becoming A Data-Aware Designer

With this article, I’d like to give UX designers the knowledge and tools to incorporate data into their daily routines.

But First, Some Data Concepts

In this article I will talk about structured data, meaning data that can be represented in a table, with rows and columns. Unstructured data, being a subject in itself, is more difficult to analyze, as Devin Pickell (content marketing specialist at G2 Crowd, writing about data and analytics) pointed out in his article “Structured vs Unstructured Data – What’s the Difference?.” If the structured data can be represented in a table form, the main concepts are:

Dataset

The entire set of data we intend to analyze. This could be, for example, an Excel table. Another popular format for storing datasets is the comma-separated value file (CSV). CSV files are simple text files used to store table-like information. Each CSV row corresponds to a row in the table, and each CSV row has values separated (naturally) by commas, which correspond to table cells.

Data Point

A single row from a dataset table is a data point. In that way, a dataset is a collection of data points.

Data Variable

A single value from a data-point row represents a data variable — put simply, a table cell. We can have two types of data variables: qualitative variables, and quantitative variables. Qualitative variables (also known as categorical variables) have a discrete set of values, such as color = red/green/blue. Quantitative variables have numerical values, such as height = 167. A quantitative variable, unlike a qualitative one, can take any value.

Creating Our Data Project

Now we know the basics, it’s time to get our hands dirty and create our first data project. The scope of the project is to analyze a dataset by going through the entire data flow of importing, processing and plotting data. First, we will choose our dataset, then we will download and install the tools for analyzing the data.

Cars Dataset

For the purpose of this article, I’ve chosen a cars dataset, because it’s simple and intuitive. The data analysis will simply confirm what we already know about the cars — which is fine, since our focus is on data flow and tools.

We can download a used cars dataset from Kaggle, one of the biggest sources of free datasets. You’ll need to register first.

After downloading the file, open it and take a look. It’s a really big CSV file, but you should get the gist. A line in this file will look like this:

19500,2015,2965,Miami,FL,WBA3B1G54FNT02351,BMW,3

As you can see, this data point has several variables separated by commas. Since we now have the dataset, let’s talk a little about tools.

Tools of the Trade

We will use the R language and RStudio to analyze the dataset. R is a very popular and easy to learn language, used not only by data scientists, but also people in financial markets, medicine and many other areas. RStudio is the environment where R projects are developed, and there’s a free version, which is more than enough for our needs as UX designers.

It’s likely that some UX designers use Excel for their data workflow. If that means you, try R — there is a good chance you’ll like it, since it is easy to learn, and more flexible and powerful than Excel. Adding R to your tool kit will make a difference.

Installing the Tools

First, we need to download and install R and RStudio. You should install R first, then RStudio. The installation processes for both R and RStudio are simple and straightforward.

Project Setup

Once the installation is complete, create a project folder — I’ve called it used-cars-prj. In that folder, create a subfolder called data, and then copy the dataset file (downloaded from Kaggle) into that folder and rename it to used-cars.csv. Now go back to our project folder (used-cars-prj) and create a plain text file called used-cars.r. You should end up with the same structure as in the screenshot below.

project folder structure

Project folder structure (Large preview)

Now we have the folder structure in place, we can open RStudio and create a new R project. Chose New Project… from the File menu and select the second option, Existing Directory. Then select the project directory (used-cars-prj). Finally, press the Create Project button and you’re done. Once the project is created, open used-cars.r in RStudio — this is the file where we will add all our R code.

Importing Data

We will add our first line in used-cars.r, for reading data from the used-cars.csv file. Remember that CSV files are just plain text files used for storing data. Our first line of R code will look like this:

cars 

It might look a little intimidating, but it really isn’t — by the way, this is the most complex line in the entire article. What we have here is the read.csv function, which takes three parameters.

The first parameter is the file to read, in our case used-cars.csv, which is located in the data folder. The second parameter, stringsAsFactors=FALSE is set to make sure strings like “BMW” or “Audi” aren’t converted to factors (the R jargon for categorical data) — as you recall, qualitative or categorical variables can have only discrete values like red/green/blue. Finally, the third parameter, sep="," specifies the kind of separator used to separate values in the CSV file: a comma.

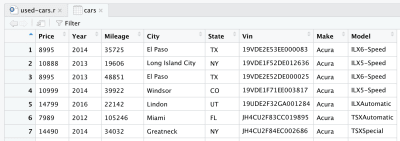
After reading the CSV file, the data is stored into the cars data frame object. A data frame is a two-dimensional data structure (like an Excel table), which is very useful in R to manipulate data. After introducing the line and running it, a cars data frame will be created for you. If you look in the top-right quadrant in RStudio, you will notice the cars data frame, in the Data section under the Environment tab. If you double click on cars, a new tab will open in the top-left quadrant of RStudio, and will present the cars data frame. As you might expect, it looks like an Excel table.

cars raw data frame

Cars raw data frame (Large preview)

This is actually the raw data we downloaded from Kaggle. But since we want to perform data analysis, we need to process our dataset first.

Data Processing

By processing, we mean removing, transforming or adding information to our dataset, in order to prepare for the kind of analysis we want to perform. We have the data in a data frame object, so now we need to install the dplyr library, a powerful library for manipulating data. To install the library in our R environment, we need to write the following line at the top of our R file.

install.packages("dplyr")

Then, to add the library to our current project, we will use the next line:

library(dplyr)

Once the dplyr library has been added to our project, we can start processing data. We have a really big dataset, and we need only the data representing the same car maker and model, in order to correlate that with price. We’ll use the following R code to keep only data concerning the BMW 3 Series, and remove the rest. Of course, you could choose any other manufacturer and model from the dataset, and expect to have the same data characteristics.

cars % filter(Make == "BMW", Model == "3")

Now we have a more manageable dataset, though still containing more than 11,000 data points, that fits with our intended purpose: to analyze the cars’ price, age and mileage distributions, and also the correlations between them. For that, we need to keep only “Price”, “Year” and “Mileage” columns and remove the rest — this is done with the following line.

cars % select(Price, Year, Mileage)

After removing other columns, our data frame will look like this:

Cars semi-processed dataframe

Cars semi-processed dataframe (Large preview)

There is one more change we want to make to our dataset: to replace the manufacture year with the age of the car. We can add the following two lines, the first to calculate the age, the second to change the column name.

cars % mutate(Year = max(Year) - Year)
cars % rename(Age = Year)

Finally, our full processed data frame looks like this:

Cars fully processed dataframe

Cars fully processed dataframe (Large preview)

At this point, our R code will look like the following, and that’s all for the data processing. We can now see how easy and powerful the R language is. We’ve processed the initial dataset quite dramatically with only a few lines of code.

install.packages("dplyr")
library(dplyr)
cars = read.csv("./data/cars.csv", stringsAsFactors = FALSE, sep=",")
cars % filter(Make == "BMW", Model == "3")
cars % select(Price, Year, Mileage)
cars % mutate(Year = max(Year) - Year)
cars % rename(Age = Year)

Data Analysis

Our data is now in the right shape, so we can go to make some plots. As already mentioned, we will focus on two aspects: individual variables’ distribution, and the correlations between them. Variable distribution helps us to understand what is considered a medium or high price for a used car — or the percentage of cars above a specific price. The same applies for the age and mileage of the cars. Correlations, on the other hand, are helpful in understanding how variables like age and mileage are related to each other.

That said, we will use two kinds of data visualization: histograms for variable distribution, and scatter plots for correlations.

Price Distribution

Plotting the car price histogram in the R language is as easy as this:

hist(cars$Price)

A small tip: if you are in RStudio you can run the code line by line; for example, in our case, you need run only the line above to display the histogram. It’s not necessary to run all the code again since you ran it once already. The histogram should look like this:

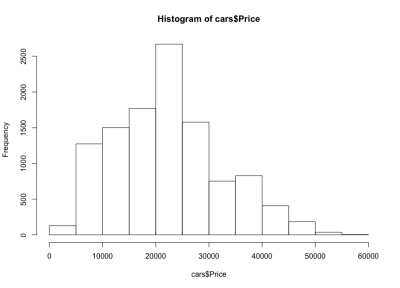
Car price distribution histogram

Car price distribution histogram (Large preview)

If we look at the histogram, we notice a bell-like distribution of the cars’ prices, which is what we expected. Most of the cars fall in the middle range, and we have fewer and fewer as we move to each side. Almost 80% of the cars are between $10,000 and $30,000 USD, and we have a maximum of more than 2,500 cars between $20,000 and $25,000 USD. On the left side we have probably around 150 cars under $5,000 USD, and on the right side even fewer. We can easily see how useful such plots are to get insights into data.

Age Distribution

Just as for the cars’ prices, we’ll use a similar line to plot the cars’ age histogram.

hist(cars$Age)

And here is the histogram:

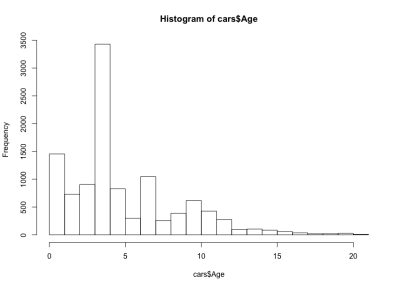
Car age distribution histogram

Car age distribution histogram (Large preview)

This time the histogram looks counterintuitive — instead of a simple bell shape, we have here four bells. Basically, the distribution has three local and one global maximum, which is unexpected. It would be interesting to see if this strange distribution of the cars’ ages stays true for another car maker and model. For the purpose of this article we’ll stay with the BMW 3 Series dataset, but you can dig deeper into the data if you are curious. Regarding our car age distribution, we notice that more than 90% of the cars are less than 10 years old, and more than 80% less than 7 years old. Also, we notice that the majority of the cars are less than 5 years old.

Mileage Distribution

Now, what can we say about mileage? Of course, we expect to have the same bell shape we had for price. Here is the R code and the histogram:

hist(cars$Mileage)

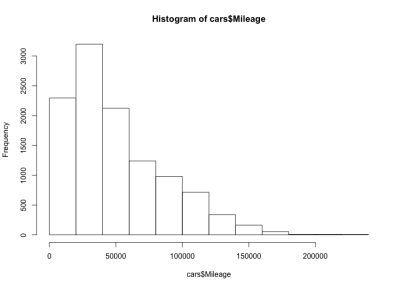
Cars mileage distribution histogram

Cars mileage distribution histogram (Large preview)

Here we have a left-skewed bell shape, meaning that there are more cars with less mileage on the market. We also notice that the majority of the cars have less than 60,000 miles, and we have a maximum around 20,000 to 40,000 miles.

Age–Price Correlation

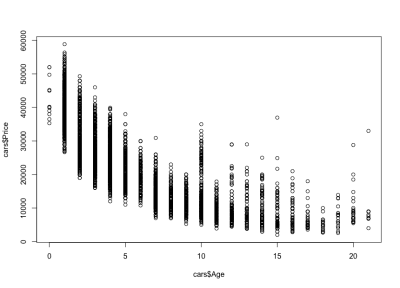
Regarding correlations, let’s take a closer look at the cars age–price correlation. We might expect the price to be negatively correlated with the age — as a car’s age increases, its price will go down. We will use the R plot function to display the price–age correlation as follows:

plot(cars$Age, cars$Price)

And the plot looks like this:

Car age–price correlation scatterplot

Car age–price correlation scatterplot (Large preview)

We notice how the cars’ prices go down with age: there are expensive new cars, and cheaper old cars. We can also see the price variation interval for any specific age, a variation that decreases with a car’s age. This variation is largely driven by the mileage, configuration and overall state of the car. For example, in the case of a 4-year-old car, the price varies between $10,000 and $40,000 USD.

Mileage–Age Correlation

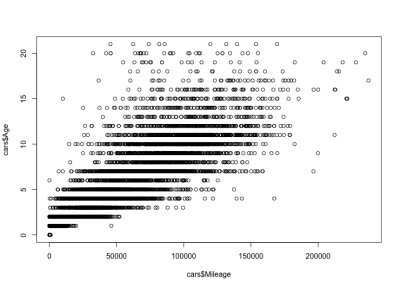
Considering the mileage–age correlation, we would expect mileage to increase with age, meaning a positive correlation. Here is the code:

plot(cars$Mileage, cars$Age)

And here is the plot:

Car mileage–age correlation scatterplot

Car mileage–age correlation scatterplot (Large preview)

As you can see, a car’s age and mileage are positively correlated, unlike a car’s price and age, which are negatively correlated. We also have an expected mileage variation for a specific age; that is, cars of the same age have varying mileages. For example, most 4-year-old cars have the mileage between 10,000 and 80,000 miles. But there are outliers too, with greater mileage.

Mileage–Price Correlation

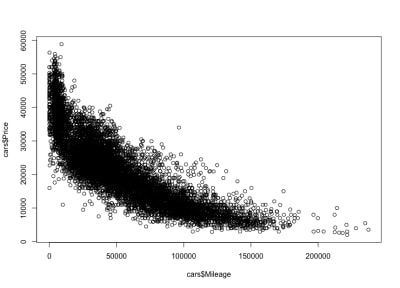
As expected, there will be a negative correlation between the cars’ mileage and the price, which means that increasing the mileage reduces the price.

plot(cars$Mileage, cars$Price)

And here is the plot:

Car mileage–price correlation scatterplot

Car mileage–price correlation scatterplot (Large preview)

As we expected, a negative correlation. We can also notice the gross price interval between $3,000 and $50,000 USD, and the mileage between 0 and 150,000. If we look closer at the distribution shape, we see that the price goes down much faster for cars with less mileage than it does for cars with more mileage. There are cars with almost zero mileage, where the price drops dramatically. Also, above 200,000 miles range — because the mileage is very high — the price stays constant.

From Numbers To Data Visualizations

In this article, we used two types of visualization: histograms for data distributions, and scatter plots for data correlations. Histograms are visual representations that take the values of a data variable (actual numbers) and show how they are distributed across a range. We used the R hist() function to plot a histogram.

Scatter plots, on the other hand, take pairs of numbers and represent them on two axes. Scatter plots use the plot() function and provide two parameters: the first and the second data variables of the correlation we want to investigate. Thus, the two R functions, hist() and plot() help us translate sets of numbers in meaningful visual representations.

Conclusion

Having got our hands dirty going through the entire data flow of importing, processing, and plotting data, things look much clearer now. You can apply the same data flow to any shiny new dataset that you will encounter. In user research, for example, you could graph time on task or error distributions, and you could also plot a time on task vs. error correlation.

To learn more about the R language Quick-R is a good place to start, but you could also consider R Bloggers. For documentation on R packages, like dplyr, you can visit RDocumentation. Playing with data can be fun, but it is also extremely helpful to any UX designer in a data-driven world. As more data is collected and used to inform business decisions, there is an increased chance for designers to work on data visualization or data products, where understanding the nature of data is essential.

(ah, il, og)
Categories: Others Tags:

Two Lessons I Learned From Making React Components

December 19th, 2019 No comments

Here’s a couple of lessons I’ve learned about how not to build React components. These are things I’ve come across over the past couple of months and thought they might be of interest to you if you’re working on a design system, especially one with a bunch of legacy technical decisions and a lot of tech debt under the hood.

Lesson 1: Avoid child components as much as you can

One thing about working on a big design system with lots of components is that the following pattern eventually starts to become problematic real quick:

<Card>
  <Card.Header>Title</Card.Header>
  <Card.Body><p>This is some content</p></Card.Body>
</Card>

The problematic parts are those child components, Card.Body and Card.Header. This example isn’t terrible because things are relatively simple — it’s when components get more complex that things can get bonkers. For example, each child component can have a whole series of complex props that interfere with the others.

One of my biggest pain points is with our Form components. Take this:

<Form>
  <Input />
  <Form.Actions>
    <Button>Submit</Button>
    <Button>Cancel</Button>
  </Form.Actions>
</Form>

I’m simplifying things considerably, of course, but every time an engineer wants to place two buttons next to each other, they’d import Form.Actions, even if there wasn’t a Form on the page. This meant that everything inside the Form component gets imported and that’s ultimately bad for performance. It just so happens to be bad system design implementation as well.

This also makes things extra difficult when documenting components because now you’ll have to ensure that each of these child components are documented too.

So instead of making Form.Actions a child component, we should’ve made it a brand new component, simply: FormActions (or perhaps something with a better name like ButtonGroup). That way, we don’t have to import Form all the time and we can keep layout-based components separate from the others.

I’ve learned my lesson. From here on out I’ll be avoiding child components altogether where I can.

Lesson 2: Make sure your props don’t conflict with one another

Mandy Michael wrote a great piece about how props can bump into one another and cause all sorts of confusing conflicts, like this TypeScript example:

interface Props {
  hideMedia?: boolean
  mediaIsEdgeToEdge?: boolean
  mediaFullHeight?: boolean
  videoInline?: boolean
}

Mandy writes:

The purpose of these props are to change the way the image or video is rendered within the card or if the media is rendered at all. The problem with defining them separately is that you end up with a number of flags which toggle component features, many of which are mutually exclusive. For example, you can’t have an image that fills the margins if it’s also hidden.

This was definitely a problem for a lot of the components we inherited in my team’s design systems. There were a bunch of components where boolean props would make a component behave in all sorts of odd and unexpected ways. We even had all sorts of bugs pop up in our Card component during development because the engineers wouldn’t know which props to turn on and turn off for any given effect!

Mandy offers the following solution:

type MediaMode = 'hidden'| 'edgeToEdge' | 'fullHeight'

interface Props {
  mediaMode: 'hidden'| 'edgeToEdge' | 'fullHeight'
}

In short: if we combine all of these nascent options together then we have a much cleaner API that’s easily extendable and is less likely to cause confusion in the future.


That’s it! I just wanted to make a quick note about those two lessons. Here’s my question for you: What have you learned when it comes to making components or working on design systems?

The post Two Lessons I Learned From Making React Components appeared first on CSS-Tricks.

Categories: Designing, Others Tags:

Print-Inspired Layout on the Web

December 18th, 2019 No comments

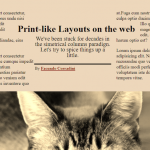
I always love seeing people get inspired by print design and trying to port it over to the web. There is a much deeper history of interesting print work to draw from, and still a ton of modern work happening that eclipses most digital design work today. The web is fully capable of bold, interesting designs, yet we see it all-too-rarely.

Just lately, we’ve seen a little surge of interest…

Dan Davies took inspiration from nine different print articles and built layouts that are similar in spirit to each of them.


Ahmad Shadeed rebuilt a rather complex grid layout with bold typography inspired by an image from a book.


Facundo Corradini built out a design from The New York Times Style Magazine.


Frederick O’Brien compared newspaper design to web design.

Read more…

Categories: Designing, Others Tags:

The Making of a “Special Series” on a WordPress Site

December 18th, 2019 No comments

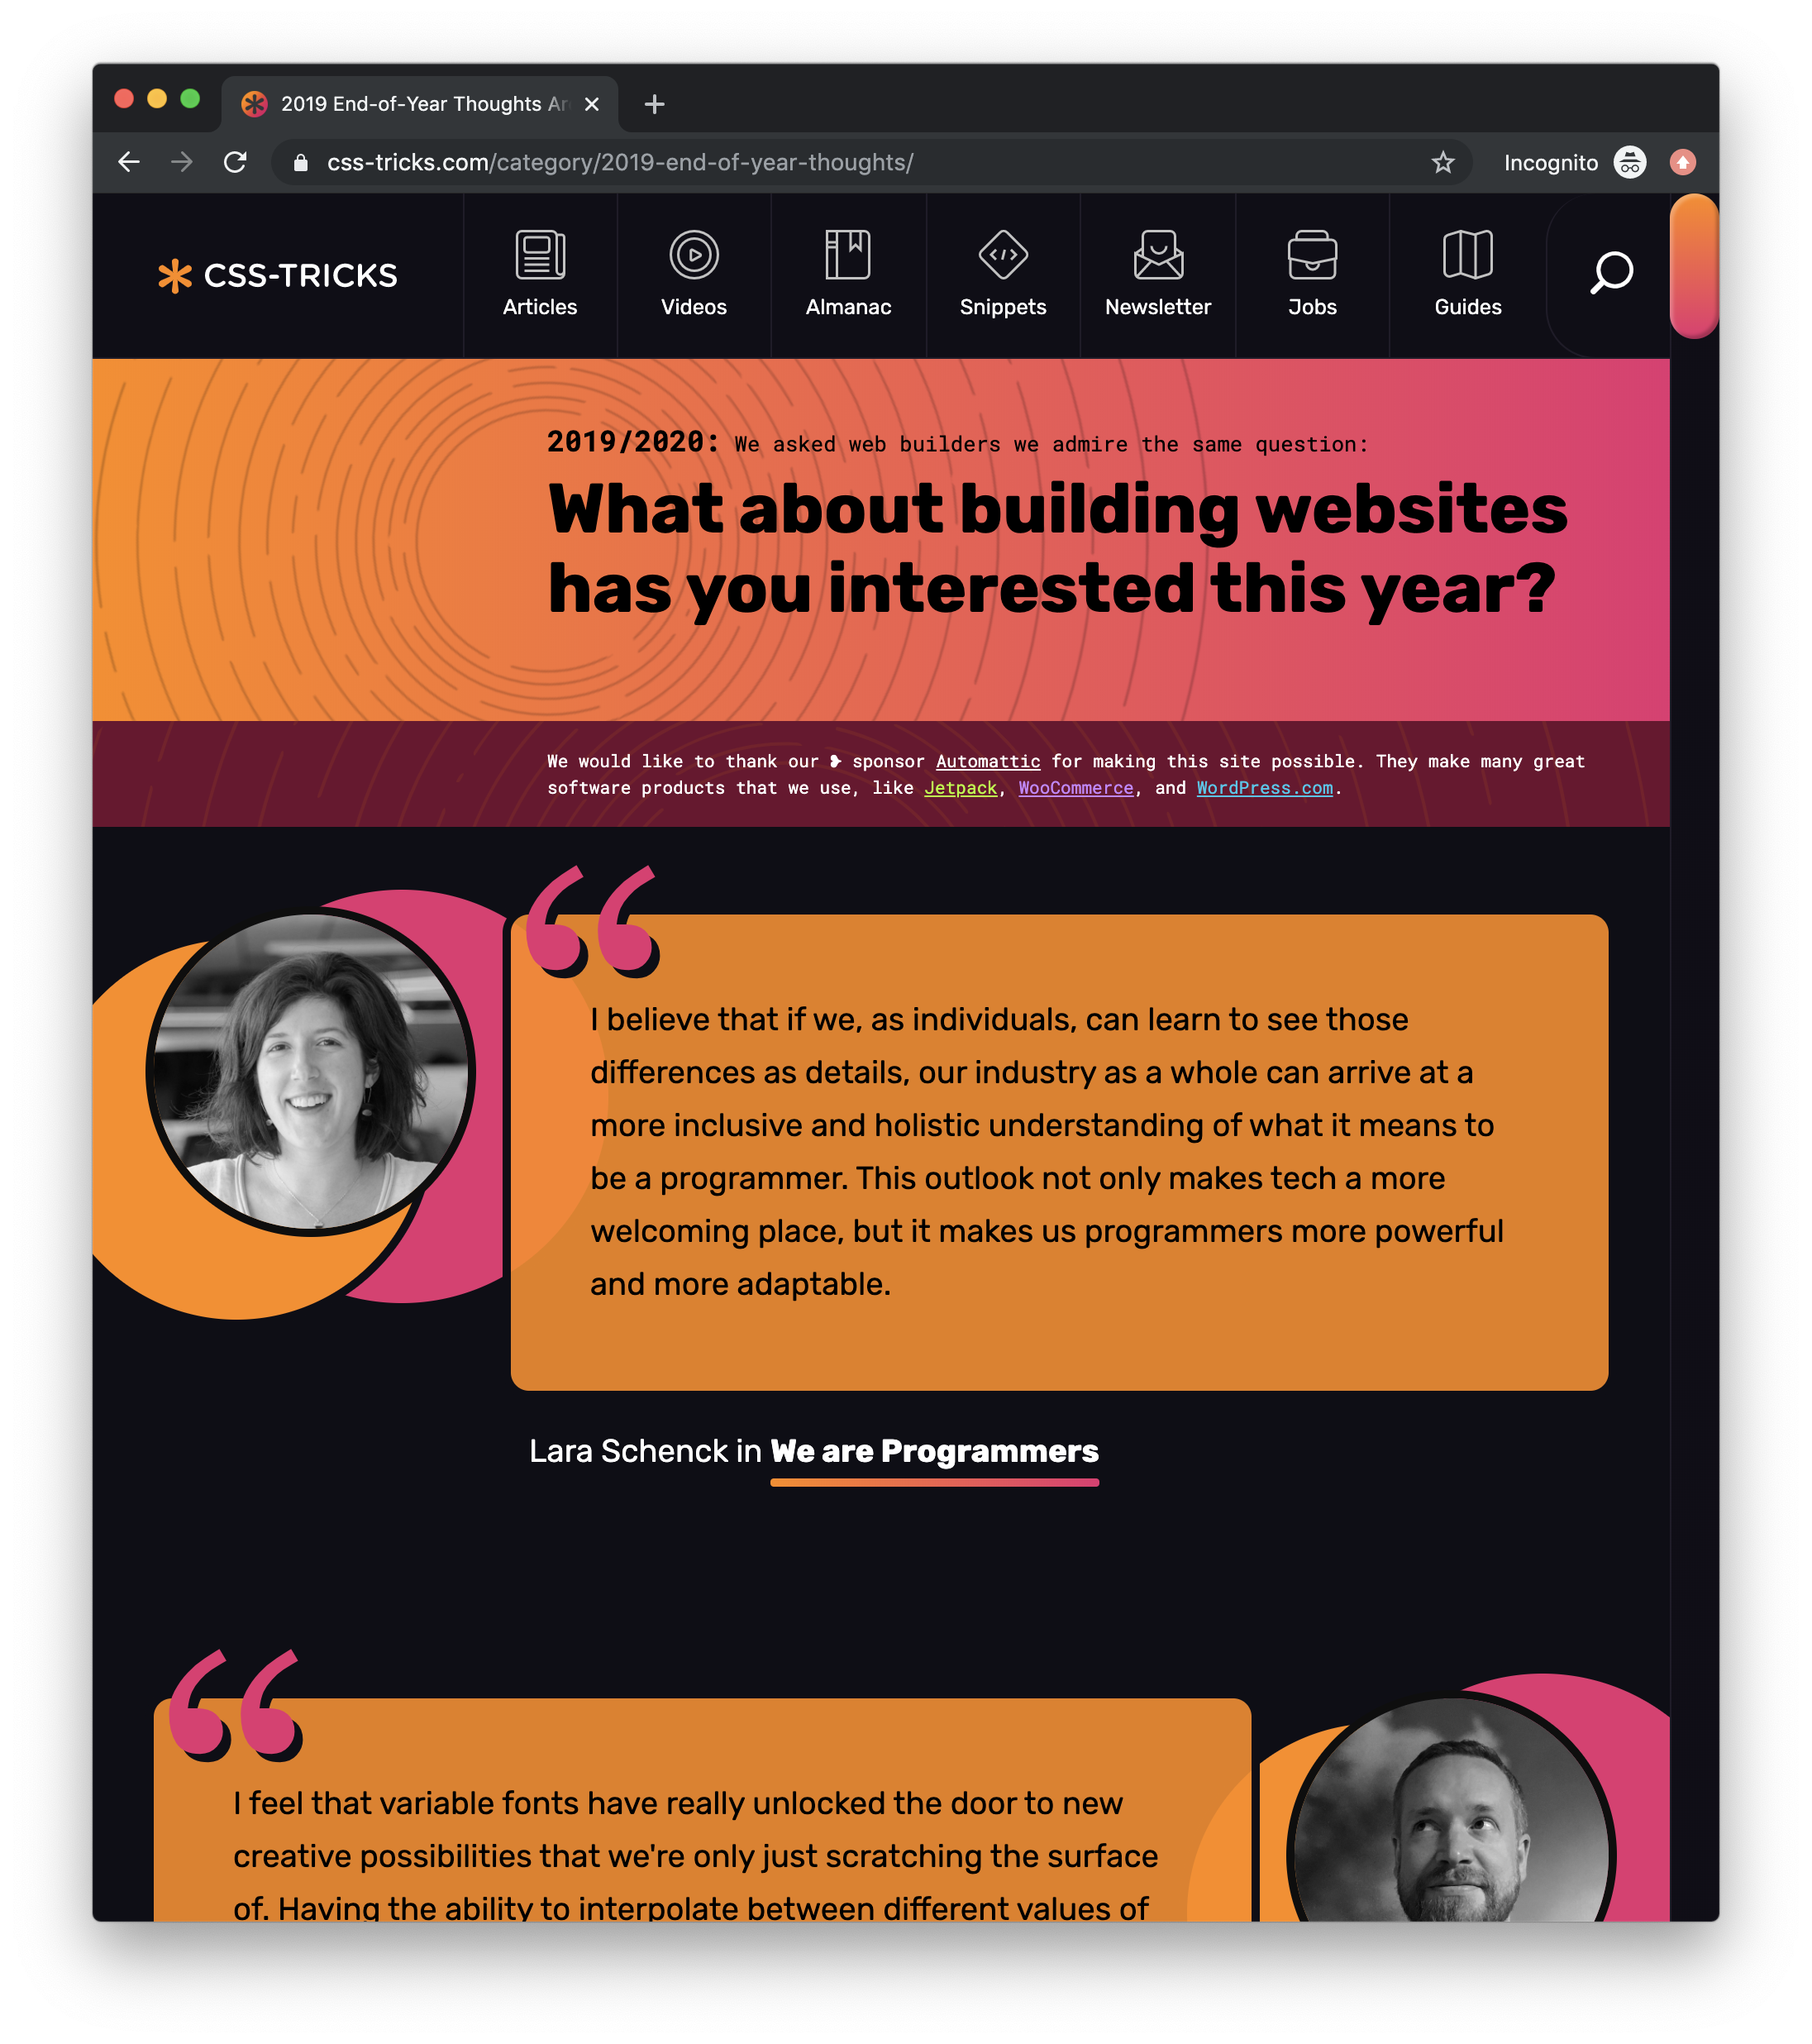
We just ran a fancy article series here on CSS-Tricks with a bunch of different articles all answering the same question. By fancy, I mean two things:

  • The articles had a specially-designed template just for them. (Example)
  • The series has a specially-designed landing page.

One of the reasons I enjoy working with WordPress is because of how easy this is to pull off. I’m sure any CMS has their own ways of doing this, and I don’t mean it to be a battle-of-CMSs thing here. I just want to illustrate how easy I found this to pull off in WordPress.

Any post can have a template

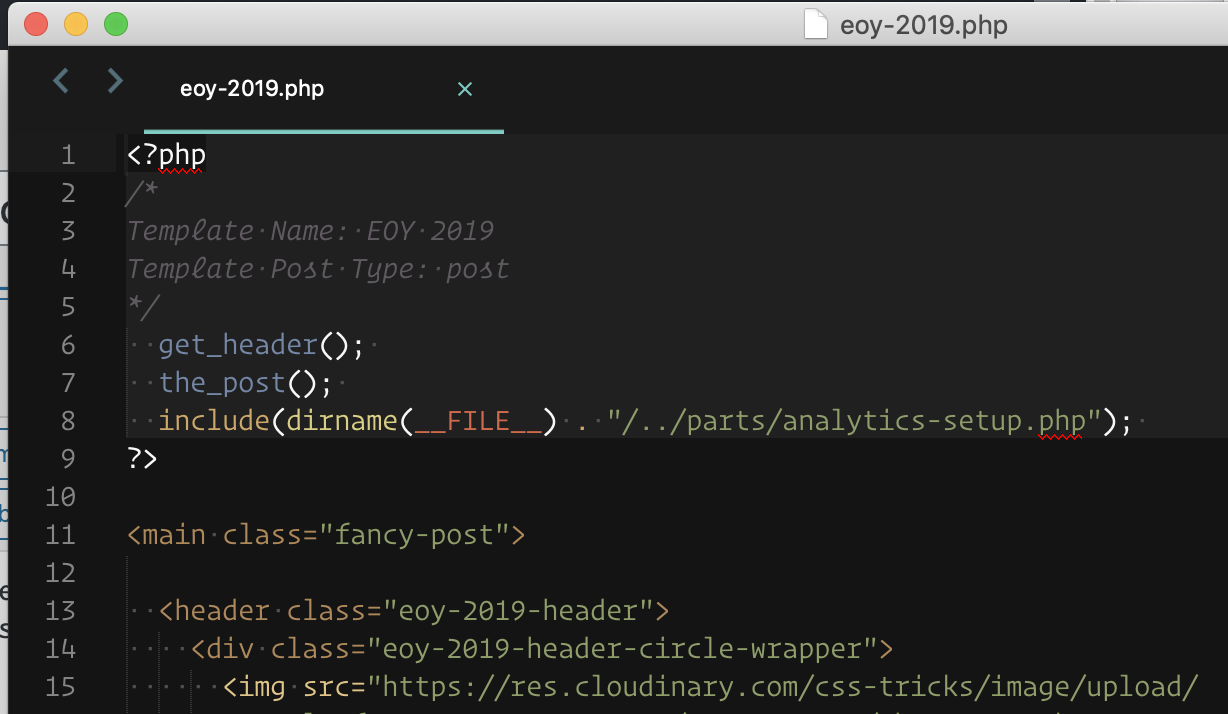
I made a PHP file in the theme directory called eoy-2019.php (eoy meaning “End of Year,” the spirit of this series). At the top of this file is some special code comments to make it read as a template:

<?php
/*
Template Name: EOY 2019
Template Post Type: post
*/

Now any post we publish can select this template from a dropdown:

And they’ll use our cool template now!

Special scripts and styles for that template

I actually didn’t need any scripting for this, but it’s the same concept as styles.

I put a conditional check in my header.php file that would load up a CSS file I created just for these posts.

if (is_page_template('art-direction/eoy-2019.php') || is_category('2019-end-of-year-thoughts')) {
  wp_enqueue_style('eoy-2019', get_template_directory_uri() . "/css/eoy-2019.css?version=7");
}

A special template for the whole group

I could have grouped the posts together in any number of ways:

  • I could have made a special Page template for these posts and designed that to link to these special posts manually or with a custom query/loop.
  • I could have had them share a tag, and then created a special tag archive page for them.
  • I could have used the same system we used for our Guides, which is a combination of CMB2 and the attached-posts plugin.

Instead, I gave all the posts the same category. That felt the most right for whatever reason. We don’t use categories a ton, but we use them for some major groups of posts, like Chronicle posts.

By using a category, I can use a special templating trick. Naming the file category-2019-end-of-year-thoughts.php, I can use the end of that file name to match the slug of the category name I used and it “just works,” thanks to the WordPress template hierarchy. I don’t need to write any code for that file to be used to display this category and I get the URL for free. Now I have a file I can use to build a special design just for these posts.

Future fallbacks

Let’s say it’s five years from now and I’ve kinda stopped caring about the super special styling and treatment behind these posts. I don’t know if that will happen, but it might. All these special files can just be deleted without hurting the content or URLs.

Again, thanks to the template hierarchy, the special post templates will simply fall back to the regular single.php template. The category homepage will just render from the regular archive.php template. The special styles won’t be applied, but the content will be just fine and the URLs will be unchanged. Nice.

The post The Making of a “Special Series” on a WordPress Site appeared first on CSS-Tricks.

Categories: Designing, Others Tags:

css.gg

December 18th, 2019 No comments

I’m not sure what to call these icons from Astrit Malsija. The title is “500+ CSS Icons, Customizable, Retina Ready & API” and the URL is “css.gg” but they aren’t really named anything.

Anyway, their shtick is:

The ?’s first icon library designed by code.

The idea is that they don’t use clip-path, they aren’t icon fonts, they aren’t even SVG. They are just tags essentially using the shapes of CSS and pseudo elements as necessary to draw themselves. It’s a very clever approach. They’ll render super fast, like inline SVG would, because they don’t require any other resource. They don’t scale particularly well because everything is sized in px, but they have modifier classes for a handful of predefined sizes. I probably wouldn’t use these in production (inline SVG is the way to go), but still, it’s clever.

I wouldn’t call it the world’s first either. Nicolas Gallagher designed an icon set like this 10 years ago (!).

Direct Link to ArticlePermalink

The post css.gg appeared first on CSS-Tricks.

Categories: Designing, Others Tags: