Archive

Archive for March, 2020

Build a Node.js Tool to Record and Compare Google Lighthouse Reports

March 16th, 2020 No comments

In this tutorial, I’ll show you step by step how to create a simple tool in Node.js to run Google Lighthouse audits via the command line, save the reports they generate in JSON format and then compare them so web performance can be monitored as the website grows and develops.

I’m hopeful this can serve as a good introduction for any developer interested in learning about how to work with Google Lighthouse programmatically.

But first, for the uninitiated…

What is Google Lighthouse?

Google Lighthouse is one of the best-automated tools available on a web developer’s utility belt. It allows you to quickly audit a website in a number of key areas which together can form a measure of its overall quality. These are:

  • Performance
  • Accessibility
  • Best Practices
  • SEO
  • Progressive Web App

Once the audit is complete, a report is then generated on what your website does well… and not so well, with the latter intending to serve as an indicator for what your next steps should be to improve the page.

Here’s what a full report looks like.

Along with other general diagnostics and web performance metrics, a really useful feature of the report is that each of the key areas is aggregated into color-coded scores between 0-100.

Not only does this allow developers to quickly gauge the quality of a website without further analysis, but it also allows non-technical folk such as stakeholders or clients to understand as well.

For example, this means, it’s much easier to share the win with Heather from marketing after spending time improving website accessibility as she’s more able to appreciate the effort after seeing the Lighthouse accessibility score go up 50 points into the green.

But equally, Simon the project manager may not understand what Speed Index or First Contentful Paint means, but when he sees the Lighthouse report showing website performance score knee deep in the red, he knows you still have work to do.

If you’re in Chrome or the latest version of Edge, you can run a Lighthouse audit for yourself right now using DevTools. Here’s how:

You can also run a Lighthouse audit online via PageSpeed Insights or through popular performance tools, such as WebPageTest.

However, today, we’re only interested in Lighthouse as a Node module, as this allows us to use the tool programmatically to audit, record and compare web performance metrics.

Let’s find out how.

Setup

First off, if you don’t already have it, you’re going to need Node.js. There are a million different ways to install it. I use the Homebrew package manager, but you can also download an installer straight from the Node.js website if you prefer. This tutorial was written with Node.js v10.17.0 in mind, but will very likely work just fine on the most versions released in the last few years.

You’re also going to need Chrome installed, as that’s how we’ll be running the Lighthouse audits.

Next, create a new directory for the project and then cd into it in the console. Then run npm init to begin to create a package.json file. At this point, I’d recommend just bashing the Enter key over and over to skip as much of this as possible until the file is created.

Now, let’s create a new file in the project directory. I called mine lh.js, but feel free to call it whatever you want. This will contain all of JavaScript for the tool. Open it in your text editor of choice, and for now, write a console.log statement.

console.log('Hello world');

Then in the console, make sure your CWD (current working directory) is your project directory and run node lh.js, substituting my file name for whatever you’ve used.

You should see:

$ node lh.js
Hello world

If not, then check your Node installation is working and you’re definitely in the correct project directory.

Now that’s out of the way, we can move on to developing the tool itself.

Opening Chrome with Node.js

Let’s install our project’s first dependency: Lighthouse itself.

npm install lighthouse --save-dev

This creates a node_modules directory that contains all of the package’s files. If you’re using Git, the only thing you’ll want to do with this is add it to your .gitignore file.

In lh.js, you’ll next want to delete the test console.log() and import the Lighthouse module so you can use it in your code. Like so:

const lighthouse = require('lighthouse');

Below it, you’ll also need to import a module called chrome-launcher, which is one of Lighthouse’s dependencies and allows Node to launch Chrome by itself so the audit can be run.

const lighthouse = require('lighthouse');
const chromeLauncher = require('chrome-launcher');

Now that we have access to these two modules, let’s create a simple script which just opens Chrome, runs a Lighthouse audit, and then prints the report to the console.

Create a new function that accepts a URL as a parameter. Because we’ll be running this using Node.js, we’re able to safely use ES6 syntax as we don’t have to worry about those pesky Internet Explorer users.

const launchChrome = (url) => {

}

Within the function, the first thing we need to do is open Chrome using the chrome-launcher module we imported and send it to whatever argument is passed through the url parameter.

We can do this using its launch() method and its startingUrl option.

const launchChrome = url => {
  chromeLauncher.launch({
    startingUrl: url
  });
};

Calling the function below and passing a URL of your choice results in Chrome being opened at the URL when the Node script is run.

launchChrome('https://www.lukeharrison.dev');

The launch function actually returns a promise, which allows us to access an object containing a few useful methods and properties.

For example, using the code below, we can open Chrome, print the object to the console, and then close Chrome three seconds later using its kill() method.

const launchChrome = url => {
  chromeLauncher
    .launch({
      startingUrl: url
    })
    .then(chrome => {
      console.log(chrome);
      setTimeout(() => chrome.kill(), 3000);
    });
};

launchChrome("https://www.lukeharrison.dev");

Now that we’ve got Chrome figured out, let’s move on to Lighthouse.

Running Lighthouse programmatically

First off, let’s rename our launchChrome() function to something more reflective of its final functionality: launchChromeAndRunLighthouse(). With the hard part out of the way, we can now use the Lighthouse module we imported earlier in the tutorial.

In the Chrome launcher’s then function, which only executes once the browser is open, we’ll pass Lighthouse the function’s url argument and trigger an audit of this website.

const launchChromeAndRunLighthouse = url => {
  chromeLauncher
    .launch({
      startingUrl: url
    })
    .then(chrome => {
      const opts = {
        port: chrome.port
      };
      lighthouse(url, opts);
    });
};

launchChromeAndRunLighthouse("https://www.lukeharrison.dev");

To link the lighthouse instance to our Chrome browser window, we have to pass its port along with the URL.

If you were to run this script now, you will hit an error in the console:

(node:47714) UnhandledPromiseRejectionWarning: Error: You probably have multiple tabs open to the same origin.

To fix this, we just need to remove the startingUrl option from Chrome Launcher and let Lighthouse handle URL navigation from here on out.

const launchChromeAndRunLighthouse = url => {
  chromeLauncher.launch().then(chrome => {
    const opts = {
      port: chrome.port
    };
    lighthouse(url, opts);
  });
};

If you were to execute this code, you’ll notice that something definitely seems to be happening. We just aren’t getting any feedback in the console to confirm the Lighthouse audit has definitely run, nor is the Chrome instance closing by itself like before.

Thankfully, the lighthouse() function returns a promise which lets us access the audit results.

Let’s kill Chrome and then print those results to the terminal in JSON format via the report property of the results object.

const launchChromeAndRunLighthouse = url => {
  chromeLauncher.launch().then(chrome => {
    const opts = {
      port: chrome.port
    };
    lighthouse(url, opts).then(results => {
      chrome.kill();
      console.log(results.report);
    });
  });
};

While the console isn’t the best way to display these results, if you were to copy them to your clipboard and visit the Lighthouse Report Viewer, pasting here will show the report in all of its glory.

At this point, it’s important to tidy up the code a little to make the launchChromeAndRunLighthouse() function return the report once it’s finished executing. This allows us to process the report later without resulting in a messy pyramid of JavaScript.

const lighthouse = require("lighthouse");
const chromeLauncher = require("chrome-launcher");

const launchChromeAndRunLighthouse = url => {
  return chromeLauncher.launch().then(chrome => {
    const opts = {
      port: chrome.port
    };
    return lighthouse(url, opts).then(results => {
      return chrome.kill().then(() => results.report);
    });
  });
};

launchChromeAndRunLighthouse("https://www.lukeharrison.dev").then(results => {
  console.log(results);
});

One thing you may have noticed is that our tool is only able to audit a single website at the moment. Let’s change this so you can pass the URL as an argument via the command line.

To take the pain out of working with command-line arguments, we’ll handle them with a package called yargs.

npm install --save-dev yargs

Then import it at the top of your script along with Chrome Launcher and Lighthouse. We only need its argv function here.

const lighthouse = require('lighthouse');
const chromeLauncher = require('chrome-launcher');
const argv = require('yargs').argv;

This means if you were to pass a command line argument in the terminal like so:

node lh.js --url https://www.google.co.uk

…you can access the argument in the script like so:

const url = argv.url // https://www.google.co.uk

Let’s edit our script to pass the command line URL argument to the function’s url parameter. It’s important to add a little safety net via the if statement and error message in case no argument is passed.

if (argv.url) {
  launchChromeAndRunLighthouse(argv.url).then(results => {
    console.log(results);
  });
} else {
  throw "You haven't passed a URL to Lighthouse";
}

Tada! We have a tool that launches Chrome and runs a Lighthouse audit programmatically before printing the report to the terminal in JSON format.

Saving Lighthouse reports

Having the report printed to the console isn’t very useful as you can’t easily read its contents, nor are they aren’t saved for future use. In this section of the tutorial, we’ll change this behavior so each report is saved into its own JSON file.

To stop reports from different websites getting mixed up, we’ll organize them like so:

  • lukeharrison.dev
    • 2020-01-31T18:18:12.648Z.json
    • 2020-01-31T19:10:24.110Z.json
  • cnn.com
    • 2020-01-14T22:15:10.396Z.json
  • lh.js

We’ll name the reports with a timestamp indicating when the date/time the report was generated. This will mean no two report file names will ever be the same, and it’ll help us easily distinguish between reports.

There is one issue with Windows that requires our attention: the colon (:) is an illegal character for file names. To mitigate this issue, we’ll replace any colons with underscores (_), so a typical report filename will look like:

  • 2020-01-31T18_18_12.648Z.json

Creating the directory

First, we need to manipulate the command line URL argument so we can use it for the directory name.

This involves more than just removing the www, as it needs to account for audits run on web pages which don’t sit at the root (eg: www.foo.com/bar), as the slashes are invalid characters for directory names.

For these URLs, we’ll replace the invalid characters with underscores again. That way, if you run an audit on https://www.foo.com/bar, the resulting directory name containing the report would be foo.com_bar.

To make dealing with URLs easier, we’ll use a native Node.js module called url. This can be imported like any other package and without having to add it to thepackage.json and pull it via npm.

const lighthouse = require('lighthouse');
const chromeLauncher = require('chrome-launcher');
const argv = require('yargs').argv;
const url = require('url');

Next, let’s use it to instantiate a new URL object.

if (argv.url) {
  const urlObj = new URL(argv.url);

  launchChromeAndRunLighthouse(argv.url).then(results => {
    console.log(results);
  });
}

If you were to print urlObj to the console, you would see lots of useful URL data we can use.

$ node lh.js --url https://www.foo.com/bar
URL {
  href: 'https://www.foo.com/bar',
  origin: 'https://www.foo.com',
  protocol: 'https:',
  username: '',
  password: '',
  host: 'www.foo.com',
  hostname: 'www.foo.com',
  port: '',
  pathname: '/bar',
  search: '',
  searchParams: URLSearchParams {},
  hash: ''
}

Create a new variable called dirName, and use the string replace() method on the host property of our URL to get rid of the www in addition to the https protocol:

const urlObj = new URL(argv.url);
let dirName = urlObj.host.replace('www.','');

We’ve used let here, which unlike const can be reassigned, as we’ll need to update the reference if the URL has a pathname, to replace slashes with underscores. This can be done with a regular expression pattern, and looks like this:

const urlObj = new URL(argv.url);
let dirName = urlObj.host.replace("www.", "");
if (urlObj.pathname !== "/") {
  dirName = dirName + urlObj.pathname.replace(///g, "_");
}

Now we can create the directory itself. This can be done through the use of another native Node.js module called fs (short for “file system”).

const lighthouse = require('lighthouse');
const chromeLauncher = require('chrome-launcher');
const argv = require('yargs').argv;
const url = require('url');
const fs = require('fs');

We can use its mkdir() method to create a directory, but first have to use its existsSync() method to check if the directory already exists, as Node.js would otherwise throw an error:

const urlObj = new URL(argv.url);
let dirName = urlObj.host.replace("www.", "");
if (urlObj.pathname !== "/") {
  dirName = dirName + urlObj.pathname.replace(///g, "_");
}
if (!fs.existsSync(dirName)) {
  fs.mkdirSync(dirName);
}

Testing the script at the point should result in a new directory being created. Passing https://www.bbc.co.uk/news as the URL argument would result in a directory named bbc.co.uk_news.

Saving the report

In the then function for launchChromeAndRunLighthouse(), we want to replace the existing console.log with logic to write the report to disk. This can be done using the fs module’s writeFile() method.

launchChromeAndRunLighthouse(argv.url).then(results => {
  fs.writeFile("report.json", results, err => {
    if (err) throw err;
  });
});

The first parameter represents the file name, the second is the content of the file and the third is a callback containing an error object should something go wrong during the write process. This would create a new file called report.json containing the returning Lighthouse report JSON object.

We still need to send it to the correct directory, with a timestamp as its file name. The former is simple — we pass the dirName variable we created earlier, like so:

launchChromeAndRunLighthouse(argv.url).then(results => {
  fs.writeFile(`${dirName}/report.json`, results, err => {
    if (err) throw err;
  });
});

The latter though requires us to somehow retrieve a timestamp of when the report was generated. Thankfully, the report itself captures this as a data point, and is stored as the fetchTime property.

We just need to remember to swap any colons (:) for underscores (_) so it plays nice with the Windows file system.

launchChromeAndRunLighthouse(argv.url).then(results => {
  fs.writeFile(
    `${dirName}/${results["fetchTime"].replace(/:/g, "_")}.json`,
    results,
    err => {
      if (err) throw err;
    }
  );
});

If you were to run this now, rather than a timestamped.json filename, instead you would likely see an error similar to:

UnhandledPromiseRejectionWarning: TypeError: Cannot read property 'replace' of undefined

This is happening because Lighthouse is currently returning the report in JSON format, rather than an object consumable by JavaScript.

Thankfully, instead of parsing the JSON ourselves, we can just ask Lighthouse to return the report as a regular JavaScript object instead.

This requires editing the below line from:

return chrome.kill().then(() => results.report);

…to:

return chrome.kill().then(() => results.lhr);

Now, if you rerun the script, the file will be named correctly. However, when opened, it’s only content will unfortunately be…

[object Object]

This is because we’ve now got the opposite problem as before. We’re trying to render a JavaScript object without stringifying it into a JSON object first.

The solution is simple. To avoid having to waste resources on parsing or stringifying this huge object, we can return both types from Lighthouse:

return lighthouse(url, opts).then(results => {
  return chrome.kill().then(() => {
    return {
      js: results.lhr,
      json: results.report
    };
  });
});

Then we can modify the writeFile instance to this:

fs.writeFile(
  `${dirName}/${results.js["fetchTime"].replace(/:/g, "_")}.json`,
  results.json,
  err => {
    if (err) throw err;
  }
);

Sorted! On completion of the Lighthouse audit, our tool should now save the report to a file with a unique timestamped filename in a directory named after the website URL.

This means reports are now much more efficiently organized and won’t override each other no matter how many reports are saved.

Comparing Lighthouse reports

During everyday development, when I’m focused on improving performance, the ability to very quickly compare reports directly in the console and see if I’m headed in the right direction could be extremely useful. With this in mind, the requirements of this compare functionality ought to be:

  1. If a previous report already exists for the same website when a Lighthouse audit is complete, automatically perform a comparison against it and show any changes to key performance metrics.
  2. I should also be able to compare key performance metrics from any two reports, from any two websites, without having to generate a new Lighthouse report which I may not need.

What parts of a report should be compared? These are the numerical key performance metrics collected as part of any Lighthouse report. They provide insight into the objective and perceived performance of a website.

In addition, Lighthouse also collects other metrics that aren’t listed in this part of the report but are still in an appropriate format to be included in the comparison. These are:

  • Time to first byte – Time To First Byte identifies the time at which your server sends a response.
  • Total blocking time – Sum of all time periods between FCP and Time to Interactive, when task length exceeded 50ms, expressed in milliseconds.
  • Estimated input latency – Estimated Input Latency is an estimate of how long your app takes to respond to user input, in milliseconds, during the busiest 5s window of page load. If your latency is higher than 50ms, users may perceive your app as laggy.

How should the metric comparison be output to the console? We’ll create a simple percentage-based comparison using the old and new metrics to see how they’ve changed from report to report.

To allow for quick scanning, we’ll also color-code individual metrics depending on if they’re faster, slower or unchanged.

We’ll aim for this output:

First Contentful Paint is 0.49% slower
First Meaningful Paint is 0.47% slower
Speed Index is 12.92% slower
Estimated Input Latency is the same
Total Blocking Time is 85.71% faster
Max Potential First Input Delay is 10.53% faster
Time to first byte is 19.89% slower
First CPU Idle is 0.47% slower
Time to Interactive is 0.02% slower

Compare the new report against the previous report

Let’s get started by creating a new function called compareReports() just below our launchChromeAndRunLighthouse() function, which will contain all the comparison logic. We’ll give it two parameters —from and to — to accept the two reports used for the comparison.

For now, as a placeholder, we’ll just print out some data from each report to the console to validate that it’s receiving them correctly.

const compareReports = (from, to) => {
  console.log(from["finalUrl"] + " " + from["fetchTime"]);
  console.log(to["finalUrl"] + " " + to["fetchTime"]);
};

As this comparison would begin after the creation of a new report, the logic to execute this function should sit in the then function for launchChromeAndRunLighthouse().

If, for example, you have 30 reports sitting in a directory, we need to determine which one is the most recent and set it as the previous report which the new one will be compared against. Thankfully, we already decided to use a timestamp as the filename for a report, so this gives us something to work with.

First off, we need to collect any existing reports. To make this process easy, we’ll install a new dependency called glob, which allows for pattern matching when searching for files. This is critical because we can’t predict how many reports will exist or what they’ll be called.

Install it like any other dependency:

npm install glob --save-dev

Then import it at the top of the file the same way as usual:

const lighthouse = require('lighthouse');
const chromeLauncher = require('chrome-launcher');
const argv = require('yargs').argv;
const url = require('url');
const fs = require('fs');
const glob = require('glob');

We’ll use glob to collect all of the reports in the directory, which we already know the name of via the dirName variable. It’s important to set its sync option to true as we don’t want JavaScript execution to continue until we know how many other reports exist.

launchChromeAndRunLighthouse(argv.url).then(results => {
  const prevReports = glob(`${dirName}/*.json`, {
    sync: true
  });

  // et al

});

This process returns an array of paths. So if the report directory looked like this:

  • lukeharrison.dev
    • 2020-01-31T10_18_12.648Z.json
    • 2020-01-31T10_18_24.110Z.json

…then the resulting array would look like this:

[
 'lukeharrison.dev/2020-01-31T10_18_12.648Z.json',
 'lukeharrison.dev/2020-01-31T10_18_24.110Z.json'
]

Because we can only perform a comparison if a previous report exists, let’s use this array as a conditional for the comparison logic:

const prevReports = glob(`${dirName}/*.json`, {
  sync: true
});

if (prevReports.length) {
}

We have a list of report file paths and we need to compare their timestamped filenames to determine which one is the most recent.

This means we first need to collect a list of all the file names, trim any irrelevant data such as directory names, and taking care to replace the underscores (_) back with colons (:) to turn them back into valid dates again. The easiest way to do this is using path, another Node.js native module.

const path = require('path');

Passing the path as an argument to its parse method, like so:

path.parse('lukeharrison.dev/2020-01-31T10_18_24.110Z.json');

Returns this useful object:

{
  root: '',
  dir: 'lukeharrison.dev',
  base: '2020-01-31T10_18_24.110Z.json',
  ext: '.json',
  name: '2020-01-31T10_18_24.110Z'
}

Therefore, to get a list of all the timestamp file names, we can do this:

if (prevReports.length) {
  dates = [];
  for (report in prevReports) {
    dates.push(
      new Date(path.parse(prevReports[report]).name.replace(/_/g, ":"))
    );
  }
}

Which again if our directory looked like:

  • lukeharrison.dev
    • 2020-01-31T10_18_12.648Z.json
    • 2020-01-31T10_18_24.110Z.json

Would result in:

[
 '2020-01-31T10:18:12.648Z',
 '2020-01-31T10:18:24.110Z'
]

A useful thing about dates is that they’re inherently comparable by default:

const alpha = new Date('2020-01-31');
const bravo = new Date('2020-02-15');

console.log(alpha > bravo); // false
console.log(bravo > alpha); // true

So by using a reduce function, we can reduce our array of dates down until only the most recent remains:

dates = [];
for (report in prevReports) {
  dates.push(new Date(path.parse(prevReports[report]).name.replace(/_/g, ":")));
}
const max = dates.reduce(function(a, b) {
  return Math.max(a, b);
});

If you were to print the contents of max to the console, it would throw up a UNIX timestamp, so now, we just have to add another line to convert our most recent date back into the correct ISO format:

const max = dates.reduce(function(a, b) {
 return Math.max(a, b);
});
const recentReport = new Date(max).toISOString();

Assuming these are the list of reports:

  • 2020-01-31T23_24_41.786Z.json
  • 2020-01-31T23_25_36.827Z.json
  • 2020-01-31T23_37_56.856Z.json
  • 2020-01-31T23_39_20.459Z.json
  • 2020-01-31T23_56_50.959Z.json

The value of recentReport would be 2020-01-31T23:56:50.959Z.

Now that we know the most recent report, we next need to extract its contents. Create a new variable called recentReportContents beneath the recentReport variable and assign it an empty function.

As we know this function will always need to execute, rather than manually calling it, it makes sense to turn it into an IFFE (Immediately invoked function expression), which will run by itself when the JavaScript parser reaches it. This is signified by the extra parenthesis:

const recentReportContents = (() => {

})();

In this function, we can return the contents of the most recent report using the readFileSync() method of the native fs module. Because this will be in JSON format, it’s important to parse it into a regular JavaScript object.

const recentReportContents = (() => {
  const output = fs.readFileSync(
    dirName + "/" + recentReport.replace(/:/g, "_") + ".json",
    "utf8",
    (err, results) => {
      return results;
    }
  );
  return JSON.parse(output);
})();

And then, it’s a matter of calling the compareReports() function and passing both the current report and the most recent report as arguments.

compareReports(recentReportContents, results.js);

At the moment this just print out a few details to the console so we can test the report data is coming through OK:

https://www.lukeharrison.dev/ 2020-02-01T00:25:06.918Z
https://www.lukeharrison.dev/ 2020-02-01T00:25:42.169Z

If you’re getting any errors at this point, try deleting any report.json files or reports without valid content from earlier in the tutorial.

Compare any two reports

The remaining key requirement was the ability to compare any two reports from any two websites. The easiest way to implement this would be to allow the user to pass the full report file paths as command line arguments which we’ll then send to the compareReports() function.

In the command line, this would look like:

node lh.js --from lukeharrison.dev/2020-02-01T00:25:06.918Z --to cnn.com/2019-12-16T15:12:07.169Z

Achieving this requires editing the conditional if statement which checks for the presence of a URL command line argument. We’ll add an additional check to see if the user has just passed a from and to path, otherwise check for the URL as before. This way we’ll prevent a new Lighthouse audit.

if (argv.from && argv.to) {

} else if (argv.url) {
 // et al
}

Let’s extract the contents of these JSON files, parse them into JavaScript objects, and then pass them along to the compareReports() function.

We’ve already parsed JSON before when retrieving the most recent report. We can just extrapolate this functionality into its own helper function and use it in both locations.

Using the recentReportContents() function as a base, create a new function called getContents() which accepts a file path as an argument. Make sure this is just a regular function, rather than an IFFE, as we don’t want it executing as soon as the JavaScript parser finds it.

const getContents = pathStr => {
  const output = fs.readFileSync(pathStr, "utf8", (err, results) => {
    return results;
  });
  return JSON.parse(output);
};

const compareReports = (from, to) => {
  console.log(from["finalUrl"] + " " + from["fetchTime"]);
  console.log(to["finalUrl"] + " " + to["fetchTime"]);
};

Then update the recentReportContents() function to use this extrapolated helper function instead:

const recentReportContents = getContents(dirName + '/' + recentReport.replace(/:/g, '_') + '.json');

Back in our new conditional, we need to pass the contents of the comparison reports to the compareReports() function.

if (argv.from && argv.to) {
  compareReports(
    getContents(argv.from + ".json"),
    getContents(argv.to + ".json")
  );
}

Like before, this should print out some basic information about the reports in the console to let us know it’s all working fine.

node lh.js --from lukeharrison.dev/2020-01-31T23_24_41.786Z --to lukeharrison.dev/2020-02-01T11_16_25.221Z

Would lead to:

https://www.lukeharrison.dev/ 2020-01-31T23_24_41.786Z
https://www.lukeharrison.dev/ 2020-02-01T11_16_25.221Z

Comparison logic

This part of development involves building comparison logic to compare the two reports received by the compareReports() function.

Within the object which Lighthouse returns, there’s a property called audits that contains another object listing performance metrics, opportunities, and information. There’s a lot of information here, much of which we aren’t interested in for the purposes of this tool.

Here’s the entry for First Contentful Paint, one of the nine performance metrics we wish to compare:

"first-contentful-paint": {
  "id": "first-contentful-paint",
  "title": "First Contentful Paint",
  "description": "First Contentful Paint marks the time at which the first text or image is painted. [Learn more](https://web.dev/first-contentful-paint).",
  "score": 1,
  "scoreDisplayMode": "numeric",
  "numericValue": 1081.661,
  "displayValue": "1.1 s"
}

Create an array listing the keys of these nine performance metrics. We can use this to filter the audit object:

const compareReports = (from, to) => {
  const metricFilter = [
    "first-contentful-paint",
    "first-meaningful-paint",
    "speed-index",
    "estimated-input-latency",
    "total-blocking-time",
    "max-potential-fid",
    "time-to-first-byte",
    "first-cpu-idle",
    "interactive"
  ];
};

Then we’ll loop through one of the report’s audits object and then cross-reference its name against our filter list. (It doesn’t matter which audit object, as they both have the same content structure.)

If it’s in there, then brilliant, we want to use it.

const metricFilter = [
  "first-contentful-paint",
  "first-meaningful-paint",
  "speed-index",
  "estimated-input-latency",
  "total-blocking-time",
  "max-potential-fid",
  "time-to-first-byte",
  "first-cpu-idle",
  "interactive"
];

for (let auditObj in from["audits"]) {
  if (metricFilter.includes(auditObj)) {
    console.log(auditObj);
  }
}

This console.log() would print the below keys to the console:

first-contentful-paint
first-meaningful-paint
speed-index
estimated-input-latency
total-blocking-time
max-potential-fid
time-to-first-byte
first-cpu-idle
interactive

Which means we would use from['audits'][auditObj].numericValue and to['audits'][auditObj].numericValue respectively in this loop to access the metrics themselves.

If we were to print these to the console with the key, it would result in output like this:

first-contentful-paint 1081.661 890.774
first-meaningful-paint 1081.661 954.774
speed-index 15576.70313351777 1098.622294504341
estimated-input-latency 12.8 12.8
total-blocking-time 59 31.5
max-potential-fid 153 102
time-to-first-byte 16.859999999999985 16.096000000000004
first-cpu-idle 1704.8490000000002 1918.774
interactive 2266.2835 2374.3615

We have all the data we need now. We just need to calculate the percentage difference between these two values and then log it to the console using the color-coded format outlined earlier.

Do you know how to calculate the percentage change between two values? Me neither. Thankfully, everybody’s favorite monolith search engine came to the rescue.

The formula is:

((From - To) / From) x 100

So, let’s say we have a Speed Index of 5.7s for the first report (from), and then a value of 2.1s for the second (to). The calculation would be:

5.7 - 2.1 = 3.6
3.6 / 5.7 = 0.63157895
0.63157895 * 100 = 63.157895

Rounding to two decimal places would yield a decrease in the speed index of 63.16%.

Let’s put this into a helper function inside the compareReports() function, below the metricFilter array.

const calcPercentageDiff = (from, to) => {
  const per = ((to - from) / from) * 100;
  return Math.round(per * 100) / 100;
};

Back in our auditObj conditional, we can begin to put together the final report comparison output.

First off, use the helper function to generate the percentage difference for each metric.

for (let auditObj in from["audits"]) {
  if (metricFilter.includes(auditObj)) {
    const percentageDiff = calcPercentageDiff(
      from["audits"][auditObj].numericValue,
      to["audits"][auditObj].numericValue
    );
  }
}

Next, we need to output values in this format to the console:

First Contentful Paint is 0.49% slower
First Meaningful Paint is 0.47% slower
Speed Index is 12.92% slower
Estimated Input Latency is the same
Total Blocking Time is 85.71% faster
Max Potential First Input Delay is 10.53% faster
Time to first byte is 19.89% slower
First CPU Idle is 0.47% slower
Time to Interactive is 0.02% slower

This requires adding color to the console output. In Node.js, this can be done by passing a color code as an argument to the console.log() function like so:

console.log('x1b[36m', 'hello') // Would print 'hello' in cyan

You can get a full reference of color codes in this Stackoverflow question. We need green and red, so that’s x1b[32m and x1b[31m respectively. For metrics where the value remains unchanged, we’ll just use white. This would be x1b[37m.

Depending on if the percentage increase is a positive or negative number, the following things need to happen:

  • Log color needs to change (Green for negative, red for positive, white for unchanged)
  • Log text contents change.
    • ‘[Name] is X% slower for positive numbers
    • ‘[Name] is X% faster’ for negative numbers
    • ‘[Name] is unchanged’ for numbers with no percentage difference.
  • If the number is negative, we want to remove the minus/negative symbol, as otherwise, you’d have a sentence like ‘Speed Index is -92.95% faster’ which doesn’t make sense.

There are many ways this could be done. Here, we’ll use the Math.sign() function, which returns 1 if its argument is positive, 0 if well… 0, and -1 if the number is negative. That’ll do.

for (let auditObj in from["audits"]) {
  if (metricFilter.includes(auditObj)) {
    const percentageDiff = calcPercentageDiff(
      from["audits"][auditObj].numericValue,
      to["audits"][auditObj].numericValue
    );

    let logColor = "x1b[37m";
    const log = (() => {
      if (Math.sign(percentageDiff) === 1) {
        logColor = "x1b[31m";
        return `${percentageDiff + "%"} slower`;
      } else if (Math.sign(percentageDiff) === 0) {
        return "unchanged";
      } else {
        logColor = "x1b[32m";
        return `${percentageDiff + "%"} faster`;
      }
    })();
    console.log(logColor, `${from["audits"][auditObj].title} is ${log}`);
  }
}

So, there we have it.

You can create new Lighthouse reports, and if a previous one exists, a comparison is made.

And you can also compare any two reports from any two sites.

Complete source code

Here’s the completed source code for the tool, which you can also view in a Gist via the link below.

const lighthouse = require("lighthouse");
const chromeLauncher = require("chrome-launcher");
const argv = require("yargs").argv;
const url = require("url");
const fs = require("fs");
const glob = require("glob");
const path = require("path");

const launchChromeAndRunLighthouse = url => {
  return chromeLauncher.launch().then(chrome => {
    const opts = {
      port: chrome.port
    };
    return lighthouse(url, opts).then(results => {
      return chrome.kill().then(() => {
        return {
          js: results.lhr,
          json: results.report
        };
      });
    });
  });
};

const getContents = pathStr => {
  const output = fs.readFileSync(pathStr, "utf8", (err, results) => {
    return results;
  });
  return JSON.parse(output);
};

const compareReports = (from, to) => {
  const metricFilter = [
    "first-contentful-paint",
    "first-meaningful-paint",
    "speed-index",
    "estimated-input-latency",
    "total-blocking-time",
    "max-potential-fid",
    "time-to-first-byte",
    "first-cpu-idle",
    "interactive"
  ];

  const calcPercentageDiff = (from, to) => {
    const per = ((to - from) / from) * 100;
    return Math.round(per * 100) / 100;
  };

  for (let auditObj in from["audits"]) {
    if (metricFilter.includes(auditObj)) {
      const percentageDiff = calcPercentageDiff(
        from["audits"][auditObj].numericValue,
        to["audits"][auditObj].numericValue
      );

      let logColor = "x1b[37m";
      const log = (() => {
        if (Math.sign(percentageDiff) === 1) {
          logColor = "x1b[31m";
          return `${percentageDiff.toString().replace("-", "") + "%"} slower`;
        } else if (Math.sign(percentageDiff) === 0) {
          return "unchanged";
        } else {
          logColor = "x1b[32m";
          return `${percentageDiff.toString().replace("-", "") + "%"} faster`;
        }
      })();
      console.log(logColor, `${from["audits"][auditObj].title} is ${log}`);
    }
  }
};

if (argv.from && argv.to) {
  compareReports(
    getContents(argv.from + ".json"),
    getContents(argv.to + ".json")
  );
} else if (argv.url) {
  const urlObj = new URL(argv.url);
  let dirName = urlObj.host.replace("www.", "");
  if (urlObj.pathname !== "/") {
    dirName = dirName + urlObj.pathname.replace(///g, "_");
  }

  if (!fs.existsSync(dirName)) {
    fs.mkdirSync(dirName);
  }

  launchChromeAndRunLighthouse(argv.url).then(results => {
    const prevReports = glob(`${dirName}/*.json`, {
      sync: true
    });

    if (prevReports.length) {
      dates = [];
      for (report in prevReports) {
        dates.push(
          new Date(path.parse(prevReports[report]).name.replace(/_/g, ":"))
        );
      }
      const max = dates.reduce(function(a, b) {
        return Math.max(a, b);
      });
      const recentReport = new Date(max).toISOString();

      const recentReportContents = getContents(
        dirName + "/" + recentReport.replace(/:/g, "_") + ".json"
      );

      compareReports(recentReportContents, results.js);
    }

    fs.writeFile(
      `${dirName}/${results.js["fetchTime"].replace(/:/g, "_")}.json`,
      results.json,
      err => {
        if (err) throw err;
      }
    );
  });
} else {
  throw "You haven't passed a URL to Lighthouse";
}

View Gist

Next steps

With the completion of this basic Google Lighthouse tool, there’s plenty of ways to develop it further. For example:

  • Some kind of simple online dashboard that allows non-technical users to run Lighthouse audits and view metrics develop over time. Getting stakeholders behind web performance can be challenging, so something tangible they can interest with themselves could pique their interest.
  • Build support for performance budgets, so if a report is generated and performance metrics are slower than they should be, then the tool outputs useful advice on how to improve them (or calls you names).

Good luck!

The post Build a Node.js Tool to Record and Compare Google Lighthouse Reports appeared first on CSS-Tricks.

Categories: Designing, Others Tags:

Implementing Infinite Scroll And Image Lazy Loading In React

March 16th, 2020 No comments

Implementing Infinite Scroll And Image Lazy Loading In React

Implementing Infinite Scroll And Image Lazy Loading In React

Chidi Orji

2020-03-16T12:00:00+00:002020-03-18T12:07:40+00:00

If you have been looking for an alternative to pagination, infinite scroll is a good consideration. In this article, we’re going to explore some use cases for the Intersection Observer API in the context of a React functional component. The reader should possess a working knowledge of React functional components. Some familiarity with React hooks will be beneficial but not required, as we will be taking a look at a few.

Our goal is that at the end of this article, we will have implemented infinite scroll and image lazy loading using a native HTML API. We would also have learned a few more things about React Hooks. With that you can be able to implement infinite scroll and image lazy loading in your React application where necessary.

Let’s get started.

Creating Maps With React And Leaflet

Grasping information from a CSV or a JSON file isn’t only complicated, but is also tedious. Representing the same data in the form of visual aid is simpler. Shajia Abidi explains how powerful of a tool Leaflet is, and how a lot of different kinds of maps can be created. Read article ?

The Intersection Observer API

According to the MDN docs, “the Intersection Observer API provides a way to asynchronously observe changes in the intersection of a target element with an ancestor element or with a top-level document’s viewport”.

This API allows us to implement cool features such as infinite scroll and image lazy loading. The intersection observer is created by calling its constructor and passing it a callback and an options object. The callback is invoked whenever one element, called the target, intersects either the device viewport or a specified element, called the root. We can specify a custom root in the options argument or use the default value.

let observer = new IntersectionObserver(callback, options);

The API is straightforward to use. A typical example looks like this:

var intObserver = new IntersectionObserver(entries => {
    entries.forEach(entry => {
      console.log(entry)
      console.log(entry.isIntersecting) // returns true if the target intersects the root element
    })
  },
  {
    // default options
  }
);
let target = document.querySelector('#targetId');
intObserver.observe(target); // start observation

entries is a list of IntersectionObserverEntry objects. The IntersectionObserverEntry object describes an intersection change for one observed target element. Note that the callback should not handle any time-consuming task as it runs on the main thread.

The Intersection Observer API currently enjoys broad browser support, as shown on caniuse.

Intersection Observer browser support. (Large preview)

You can read more about the API in the links provided in the resources section.

Let us now look at how to make use of this API in a real React app. The final version of our app will be a page of pictures that scrolls infinitely and will have each image loaded lazily.

Making API Calls With The useEffect Hook

To get started, clone the starter project from this URL. It has minimal setup and a few styles defined. I’ve also added a link to Bootstrap‘s CSS in the public/index.html file as I’ll be using its classes for styling.

Feel free to create a new project if you like. Make sure you have yarn package manager installed if you want to follow with the repo. You can find the installation instructions for your specific operating system here.

For this tutorial, we’re going to be grabbing pictures from a public API and displaying them on the page. We will be using the Lorem Picsum APIs.

For this tutorial, we’ll be using the endpoint, https://picsum.photos/v2/list?page=0&limit=10, which returns an array of picture objects. To get the next ten pictures, we change the value of page to 1, then 2, and so on.

We will now build the App component piece by piece.

Open up src/App.js and enter the following code.

import React, { useEffect, useReducer } from 'react';

import './index.css';

function App() {
  const imgReducer = (state, action) => {
    switch (action.type) {
      case 'STACK_IMAGES':
        return { ...state, images: state.images.concat(action.images) }
      case 'FETCHING_IMAGES':
        return { ...state, fetching: action.fetching }
      default:
        return state;
    }
  }
  const [imgData, imgDispatch] = useReducer(imgReducer,{ images:[], fetching: true})
  // next code block goes here
}

Firstly, we define a reducer function, imgReducer. This reducer handles two actions.

  1. The STACK_IMAGES action concatenates the images array.
  2. FETCHING_IMAGES action toggles the value of the fetching variable between true and false.

The next step is to wire up this reducer to a useReducer hook. Once that is done, we get back two things:

  1. imgData, which contains two variables: images is the array of picture objects. fetching is a boolean which tells us if the API call is in progress or not.
  2. imgDispatch, which is a function for updating the reducer object.

You can learn more about the useReducer hook in the React documentation.

The next part of the code is where we make the API call. Paste the following code below the previous code block in App.js.

// make API calls
useEffect(() => {
  imgDispatch({ type: 'FETCHING_IMAGES', fetching: true })
  fetch('https://picsum.photos/v2/list?page=0&limit=10')
    .then(data => data.json())
    .then(images => {
      imgDispatch({ type: 'STACK_IMAGES', images })
      imgDispatch({ type: 'FETCHING_IMAGES', fetching: false })
    })
    .catch(e => {
      // handle error
      imgDispatch({ type: 'FETCHING_IMAGES', fetching: false })
      return e
    })
}, [ imgDispatch ])

// next code block goes here

Inside the useEffect hook, we make a call to the API endpoint with fetch API. We then update the images array with the result of the API call by dispatching the STACK_IMAGES action. We also dispatch the FETCHING_IMAGES action once the API call completes.

The next block of code defines the return value of the function. Enter the following code after the useEffect hook.

return (
  <div className="">
    <nav className="navbar bg-light">
      <div className="container">
        <a className="navbar-brand" href="/#">
          <h2>Infinite scroll + image lazy loading</h2>
        </a>
      </div>
    </navv
    <div id='images' className="container">
      <div className="row">
        {imgData.images.map((image, index) => {
          const { author, download_url } = image
          return (
            <div key={index} className="card">
              <div className="card-body ">
                <img
                  alt={author}
                  className="card-img-top"
                  src={download_url}
                />
              </div>
              <div className="card-footer">
                <p className="card-text text-center text-capitalize text-primary">Shot by: {author}</p>
              </div>
            </div>
          )
        })}
      </div>
    </div>
  </div>
);

To display the images, we map over the images array in the imgData object.

Now start the app and view the page in the browser. You should see the images nicely displayed in a responsive grid.

The last bit is to export the App component.

export default App;

Pictures in responsive grid. (Large preview)

The corresponding branch at this point is 01-make-api-calls.

Let’s now extend this by displaying more pictures as the page scrolls.

Implementing Infinite Scroll

We aim to present more pictures as the page scrolls. From the URL of the API endpoint, https://picsum.photos/v2/list?page=0&limit=10, we know that to get a new set of photos, we only need to increment the value of page. We also need to do this when we have run out of pictures to show. For our purpose here, we’ll know we have run out of images when we hit the bottom of the page. It’s time to see how the Intersection Observer API helps us achieve that.

Open up src/App.js and create a new reducer, pageReducer, below imgReducer.

// App.js
const imgReducer = (state, action) => {
  ...
}
const pageReducer = (state, action) => {
  switch (action.type) {
    case 'ADVANCE_PAGE':
      return { ...state, page: state.page + 1 }
    default:
      return state;
  }
}
const [ pager, pagerDispatch ] = useReducer(pageReducer, { page: 0 })

We define only one action type. Each time the ADVANCE_PAGE action is triggered, the value of page is incremented by 1.

Update the URL in the fetch function to accept page numbers dynamically as shown below.

fetch(`https://picsum.photos/v2/list?page=${pager.page}&limit=10`)

Add pager.page to the dependency array alongside imgData. Doing this ensures that the API call will run whenever pager.page changes.

useEffect(() => {
...
}, [ imgDispatch, pager.page ])

After the useEffect hook for the API call, enter the below code. Update your import line as well.

// App.js
import React, { useEffect, useReducer, useCallback, useRef } from 'react';
useEffect(() => {
  ...
}, [ imgDispatch, pager.page ])

// implement infinite scrolling with intersection observer
let bottomBoundaryRef = useRef(null);
const scrollObserver = useCallback(
  node => {
    new IntersectionObserver(entries => {
      entries.forEach(en => {
        if (en.intersectionRatio > 0) {
          pagerDispatch({ type: 'ADVANCE_PAGE' });
        }
      });
    }).observe(node);
  },
  [pagerDispatch]
);
useEffect(() => {
  if (bottomBoundaryRef.current) {
    scrollObserver(bottomBoundaryRef.current);
  }
}, [scrollObserver, bottomBoundaryRef]);

We define a variable bottomBoundaryRef and set its value to useRef(null). useRef lets variables preserve their values across component renders, i.e. the current value of the variable persists when the containing component re-renders. The only way to change its value is by re-assigning the .current property on that variable.

In our case, bottomBoundaryRef.current starts with a value of null. As the page rendering cycle proceeds, we set its current property to be the node

.

We use the assignment statement ref={bottomBoundaryRef} to tell React to set bottomBoundaryRef.current to be the div where this assignment is declared.

Thus,

bottomBoundaryRef.current = null

at the end of the rendering cycle, becomes:

bottomBoundaryRef.current = <div id="page-bottom-boundary" style="border: 1px solid red;"></div>

We shall see where this assignment is done in a minute.

Next, we define a scrollObserver function, in which to set the observer. This function accepts a DOM node to observe. The main point to note here is that whenever we hit the intersection under observation, we dispatch the ADVANCE_PAGE action. The effect is to increment the value of pager.page by 1. Once this happens, the useEffect hook that has it as a dependency is re-run. This re-run, in turn, invokes the fetch call with the new page number.

The event procession looks like this.

Hit intersection under observation ? call ADVANCE_PAGE action ? increment value of pager.page by 1 ? useEffect hook for fetch call runs ? fetch call is run ? returned images are concatenated to the images array.

We invoke scrollObserver in a useEffect hook so that the function will run only when any of the hook’s dependencies change. If we didn’t call the function inside a useEffect hook, the function would run on every page render.

Recall that bottomBoundaryRef.current refers to

. We check that its value is not null before passing it to scrollObserver. Otherwise, the IntersectionObserver constructor would return an error.

Because we used scrollObserver in a useEffect hook, we have to wrap it in a useCallback hook to prevent un-ending component re-renders. You can learn more about useCallback in the React docs.

Enter the below code after the

div.

// App.js
<div id='image'>
...
</div>
{imgData.fetching && (
  <div className="text-center bg-secondary m-auto p-3">
    <p className="m-0 text-white">Getting images</p>
  </div>
)}
<div id='page-bottom-boundary' style={{ border: '1px solid red' }} ref={bottomBoundaryRef}></div>

When the API call starts, we set fetching to true, and the text Getting images becomes visible. As soon as it finishes, we set fetching to false, and the text gets hidden. We could also trigger the API call before hitting the boundary exactly by setting a different threshold in the constructor options object. The red line at the end lets us see exactly when we hit the page boundary.

The corresponding branch at this point is 02-infinite-scroll.

We will now implement image lazy loading.

Implementing Image Lazy Loading

If you inspect the network tab as you scroll down, you’ll see that as soon as you hit the red line (the bottom boundary), the API call happens, and all the images start loading even when you haven’t gotten to viewing them. There are a variety of reasons why this might not be desirable behavior. We may want to save network calls until the user wants to see an image. In such a case, we could opt for loading the images lazily, i.e., we won’t load an image until it scrolls into view.

Open up src/App.js. Just below the infinite scrolling functions, enter the following code.

// App.js

// lazy loads images with intersection observer
// only swap out the image source if the new url exists
const imagesRef = useRef(null);
const imgObserver = useCallback(node => {
  const intObs = new IntersectionObserver(entries => {
    entries.forEach(en => {
      if (en.intersectionRatio > 0) {
        const currentImg = en.target;
        const newImgSrc = currentImg.dataset.src;
        // only swap out the image source if the new url exists
        if (!newImgSrc) {
          console.error('Image source is invalid');
        } else {
          currentImg.src = newImgSrc;
        }
        intObs.unobserve(node); // detach the observer when done
      }
    });
  })
  intObs.observe(node);
}, []);
useEffect(() => {
  imagesRef.current = document.querySelectorAll('.card-img-top');
  if (imagesRef.current) {
    imagesRef.current.forEach(img => imgObserver(img));
  }
}, [imgObserver, imagesRef, imgData.images]);

As with scrollObserver, we define a function, imgObserver, which accepts a node to observe. When the page hits an intersection, as determined by en.intersectionRatio > 0, we swap the image source on the element. Notice that we first check if the new image source exists before doing the swap. As with the scrollObserver function, we wrap imgObserver in a useCallback hook to prevent un-ending component re-render.

Also note that we stop observing an img element once we’re done with the substitution. We do this with the unobserve method.

In the following useEffect hook, we grab all the images with a class of .card-img-top on the page with document.querySelectorAll. Then we iterate over each image and set an observer on it.

Note that we added imgData.images as a dependency of the useEffect hook. When this changes it triggers the useEffect hook and in turn imgObserver get called with each element.

Update the element as shown below.

<img
  alt={author}
  data-src={download_url}
  className="card-img-top"
  src={'https://picsum.photos/id/870/300/300?grayscale&blur=2'}
/>

We set a default source for every element and store the image we want to show on the data-src property. The default image usually has a small size so that we’re downloading as little as possible. When the element comes into view, the value on the data-src property replaces the default image.

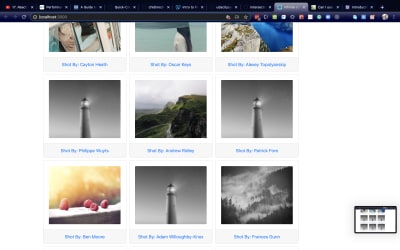
In the picture below, we see the default lighthouse image still showing in some of the spaces.

Images being lazily loaded. (Large preview)

The corresponding branch at this point is 03-lazy-loading.

Let’s now see how we can abstract all these functions so that they’re re-usable.

Abstracting Fetch, Infinite Scroll And Lazy Loading Into Custom Hooks

We have successfully implemented fetch, infinite scroll, and image lazy loading. We might have another component in our application that needs similar functionality. In that case, we could abstract and reuse these functions. All we have to do is move them inside a separate file and import them where we need them. We want to turn them into Custom Hooks.

The React documentation defines a Custom Hook as a JavaScript function whose name starts with "use" and that may call other hooks. In our case, we want to create three hooks, useFetch, useInfiniteScroll, useLazyLoading.

Create a file inside the src/ folder. Name it customHooks.js and paste the code below inside.

// customHooks.js

import { useEffect, useCallback, useRef } from 'react';
// make API calls and pass the returned data via dispatch
export const useFetch = (data, dispatch) => {
  useEffect(() => {
    dispatch({ type: 'FETCHING_IMAGES', fetching: true });
    fetch(`https://picsum.photos/v2/list?page=${data.page}&limit=10`)
      .then(data => data.json())
      .then(images => {
        dispatch({ type: 'STACK_IMAGES', images });
        dispatch({ type: 'FETCHING_IMAGES', fetching: false });
      })
      .catch(e => {
        dispatch({ type: 'FETCHING_IMAGES', fetching: false });
        return e;
      })
  }, [dispatch, data.page])
}

// next code block here

The useFetch hook accepts a dispatch function and a data object. The dispatch function passes the data from the API call to the App component, while the data object lets us update the API endpoint URL.

// infinite scrolling with intersection observer
export const useInfiniteScroll = (scrollRef, dispatch) => {
  const scrollObserver = useCallback(
    node => {
      new IntersectionObserver(entries => {
        entries.forEach(en => {
          if (en.intersectionRatio > 0) {
            dispatch({ type: 'ADVANCE_PAGE' });
          }
        });
      }).observe(node);
    },
    [dispatch]
  );
  useEffect(() => {
    if (scrollRef.current) {
      scrollObserver(scrollRef.current);
    }
  }, [scrollObserver, scrollRef]);
}

// next code block here

The useInfiniteScroll hook accepts a scrollRef and a dispatch function. The scrollRef helps us set up the observer, as already discussed in the section where we implemented it. The dispatch function gives a way to trigger an action that updates the page number in the API endpoint URL.

// lazy load images with intersection observer
export const useLazyLoading = (imgSelector, items) => {
  const imgObserver = useCallback(node => {
  const intObs = new IntersectionObserver(entries => {
    entries.forEach(en => {
      if (en.intersectionRatio > 0) {
        const currentImg = en.target;
        const newImgSrc = currentImg.dataset.src;
        // only swap out the image source if the new url exists
        if (!newImgSrc) {
          console.error('Image source is invalid');
        } else {
          currentImg.src = newImgSrc;
        }
        intObs.unobserve(node); // detach the observer when done
      }
    });
  })
  intObs.observe(node);
  }, []);
  const imagesRef = useRef(null);
  useEffect(() => {
    imagesRef.current = document.querySelectorAll(imgSelector);
    if (imagesRef.current) {
      imagesRef.current.forEach(img => imgObserver(img));
    }
  }, [imgObserver, imagesRef, imgSelector, items])
}

The useLazyLoading hook receives a selector and an array. The selector is used to find the images. Any change in the array triggers the useEffect hook that sets up the observer on each image.

We can see that it is the same functions we have in src/App.js that we have extracted to a new file. The good thing now is that we can pass arguments dynamically. Let’s now use these custom hooks in the App component.

Open src/App.js. Import the custom hooks and delete the functions we defined for fetching data, infinite scroll, and image lazy loading. Leave the reducers and the sections where we make use of useReducer. Paste in the below code.

// App.js

// import custom hooks
import { useFetch, useInfiniteScroll, useLazyLoading } from './customHooks'

  const imgReducer = (state, action) => { ... } // retain this
  const pageReducer = (state, action) => { ... } // retain this
  const [pager, pagerDispatch] = useReducer(pageReducer, { page: 0 }) // retain this
  const [imgData, imgDispatch] = useReducer(imgReducer,{ images:[], fetching: true }) // retain this

let bottomBoundaryRef = useRef(null);
useFetch(pager, imgDispatch);
useLazyLoading('.card-img-top', imgData.images)
useInfiniteScroll(bottomBoundaryRef, pagerDispatch);

// retain the return block
return (
  ...
)

We have already talked about bottomBoundaryRef in the section on infinite scroll. We pass the pager object and the imgDispatch function to useFetch. useLazyLoading accepts the class name .card-img-top. Note the . included in the class name. By doing this, we don’t need to specify it document.querySelectorAll. useInfiniteScroll accepts both a ref and the dispatch function for incrementing the value of page.

The corresponding branch at this point is 04-custom-hooks.

Conclusion

HTML is getting better at providing nice APIs for implementing cool features. In this post, we’ve seen how easy it is to use the intersection observer in a React functional component. In the process, we learned how to use some of React’s hooks and how to write our own hooks.

Resources

Smashing Editorial(ks, ra, yk, il)
Categories: Others Tags:

Exciting New Tools for Designers, March 2020

March 16th, 2020 No comments

Spring is in the air. As the season changes, many designers are looking for a little refresh of their own. Hopefully some of these new tools and resources will do the trick.

Here’s what new for designers this month.

Visme

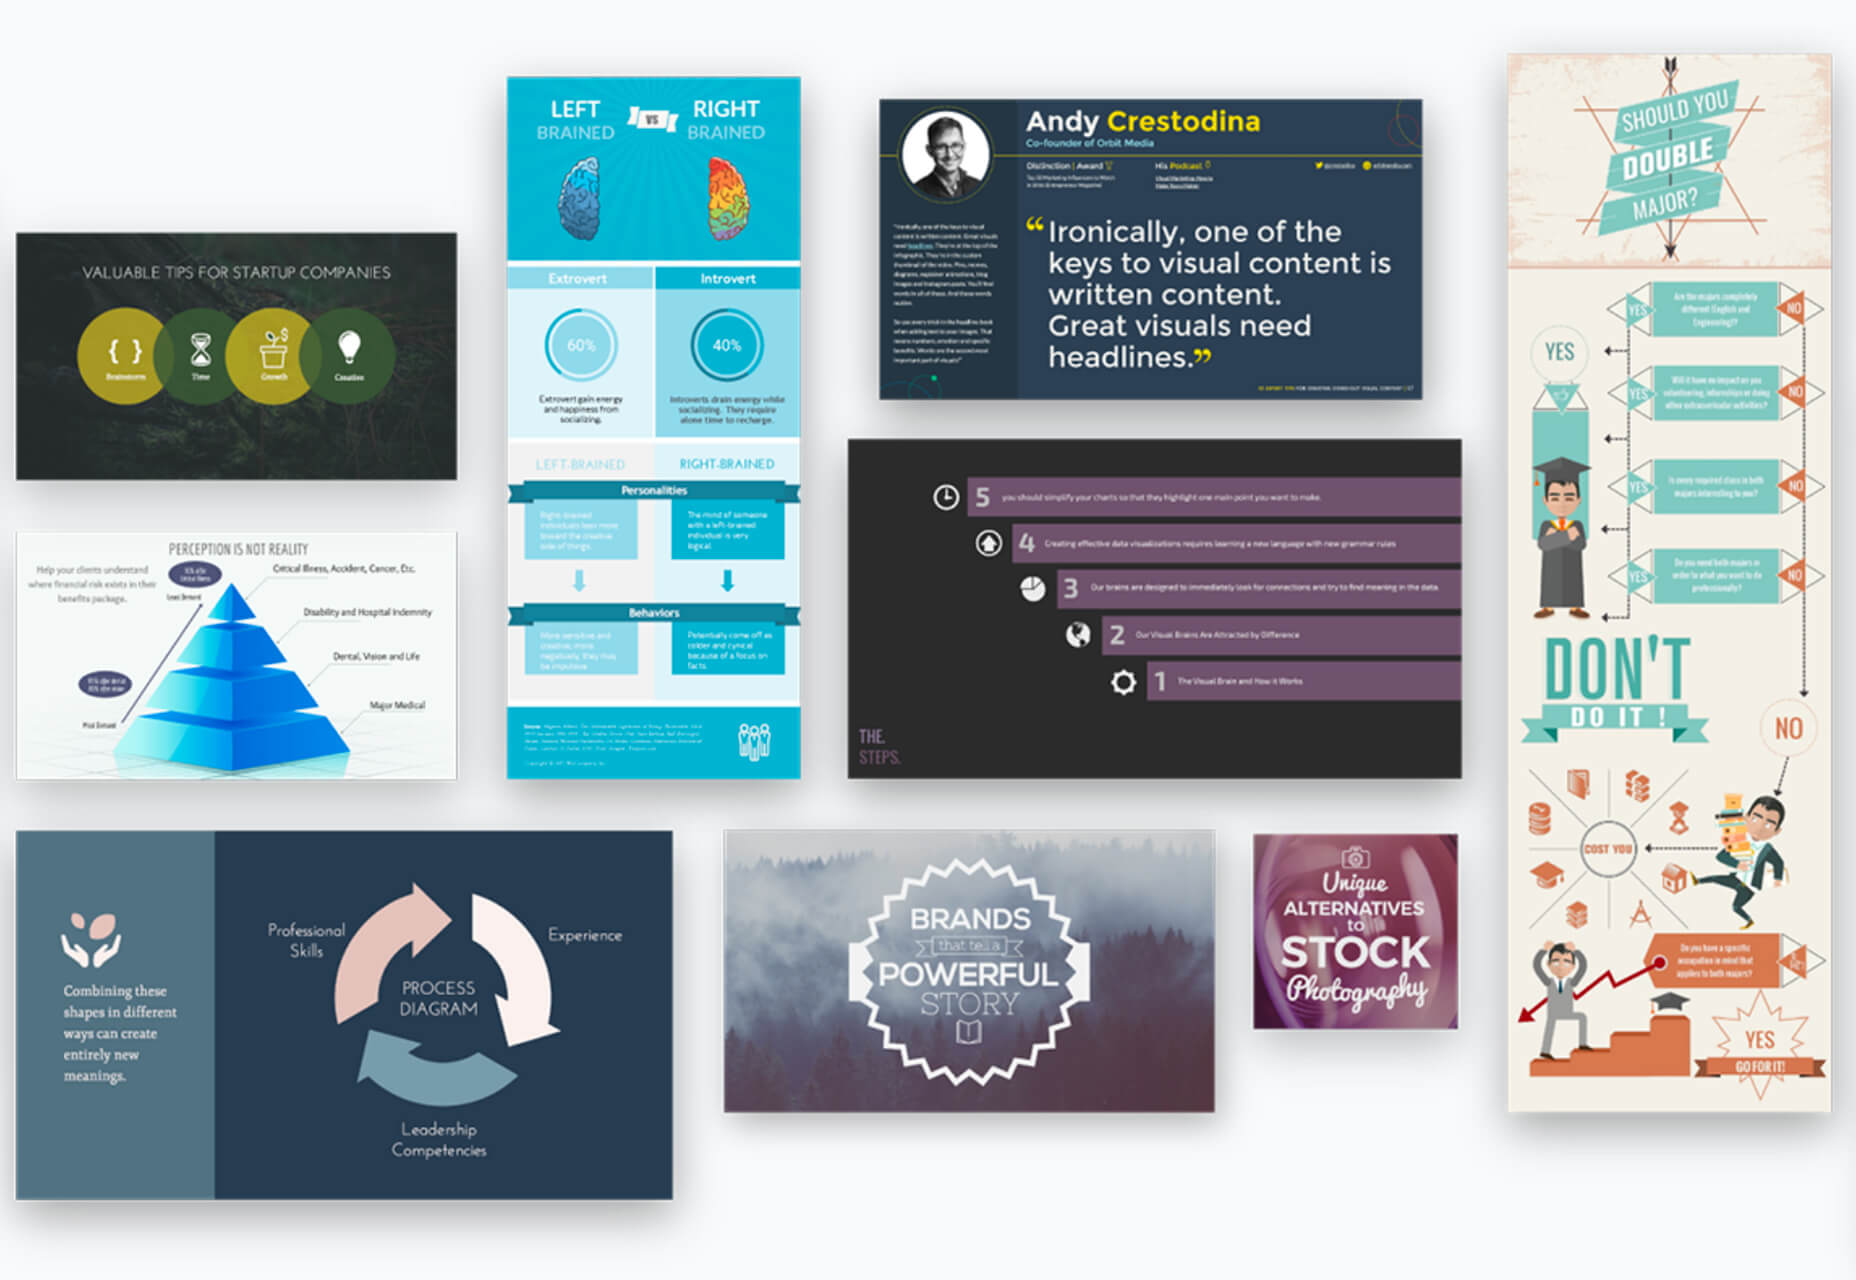
Visme allows you to quickly create and share content with tools to build presentations, infographics, documents, videos, and graphics — with little to no design skills. But it’s for designers too with features that you will appreciate in a platform that makes crafting visuals quick and easy. (It’s great for creating social media graphics, in particular!) The new release is intuitive and allows you to work with video or still images, illustrations, text, maps, and more. You can even set branding guidelines so your team can work from the free app.

Thinkers Notebook and App

The Thinkers Notebook and App brings your paper sketches to the digital space. The notebook and app work together to turn things on the page into high-res digital images that you can share, add notes to, edit and more. The best feature is the ability to collaborate and comment on handwritten notes or ideas. If you still like to use paper and pen to start the ideation process this tool is for you. (The app is free and the notebook is under $20.)

Opensource Builders

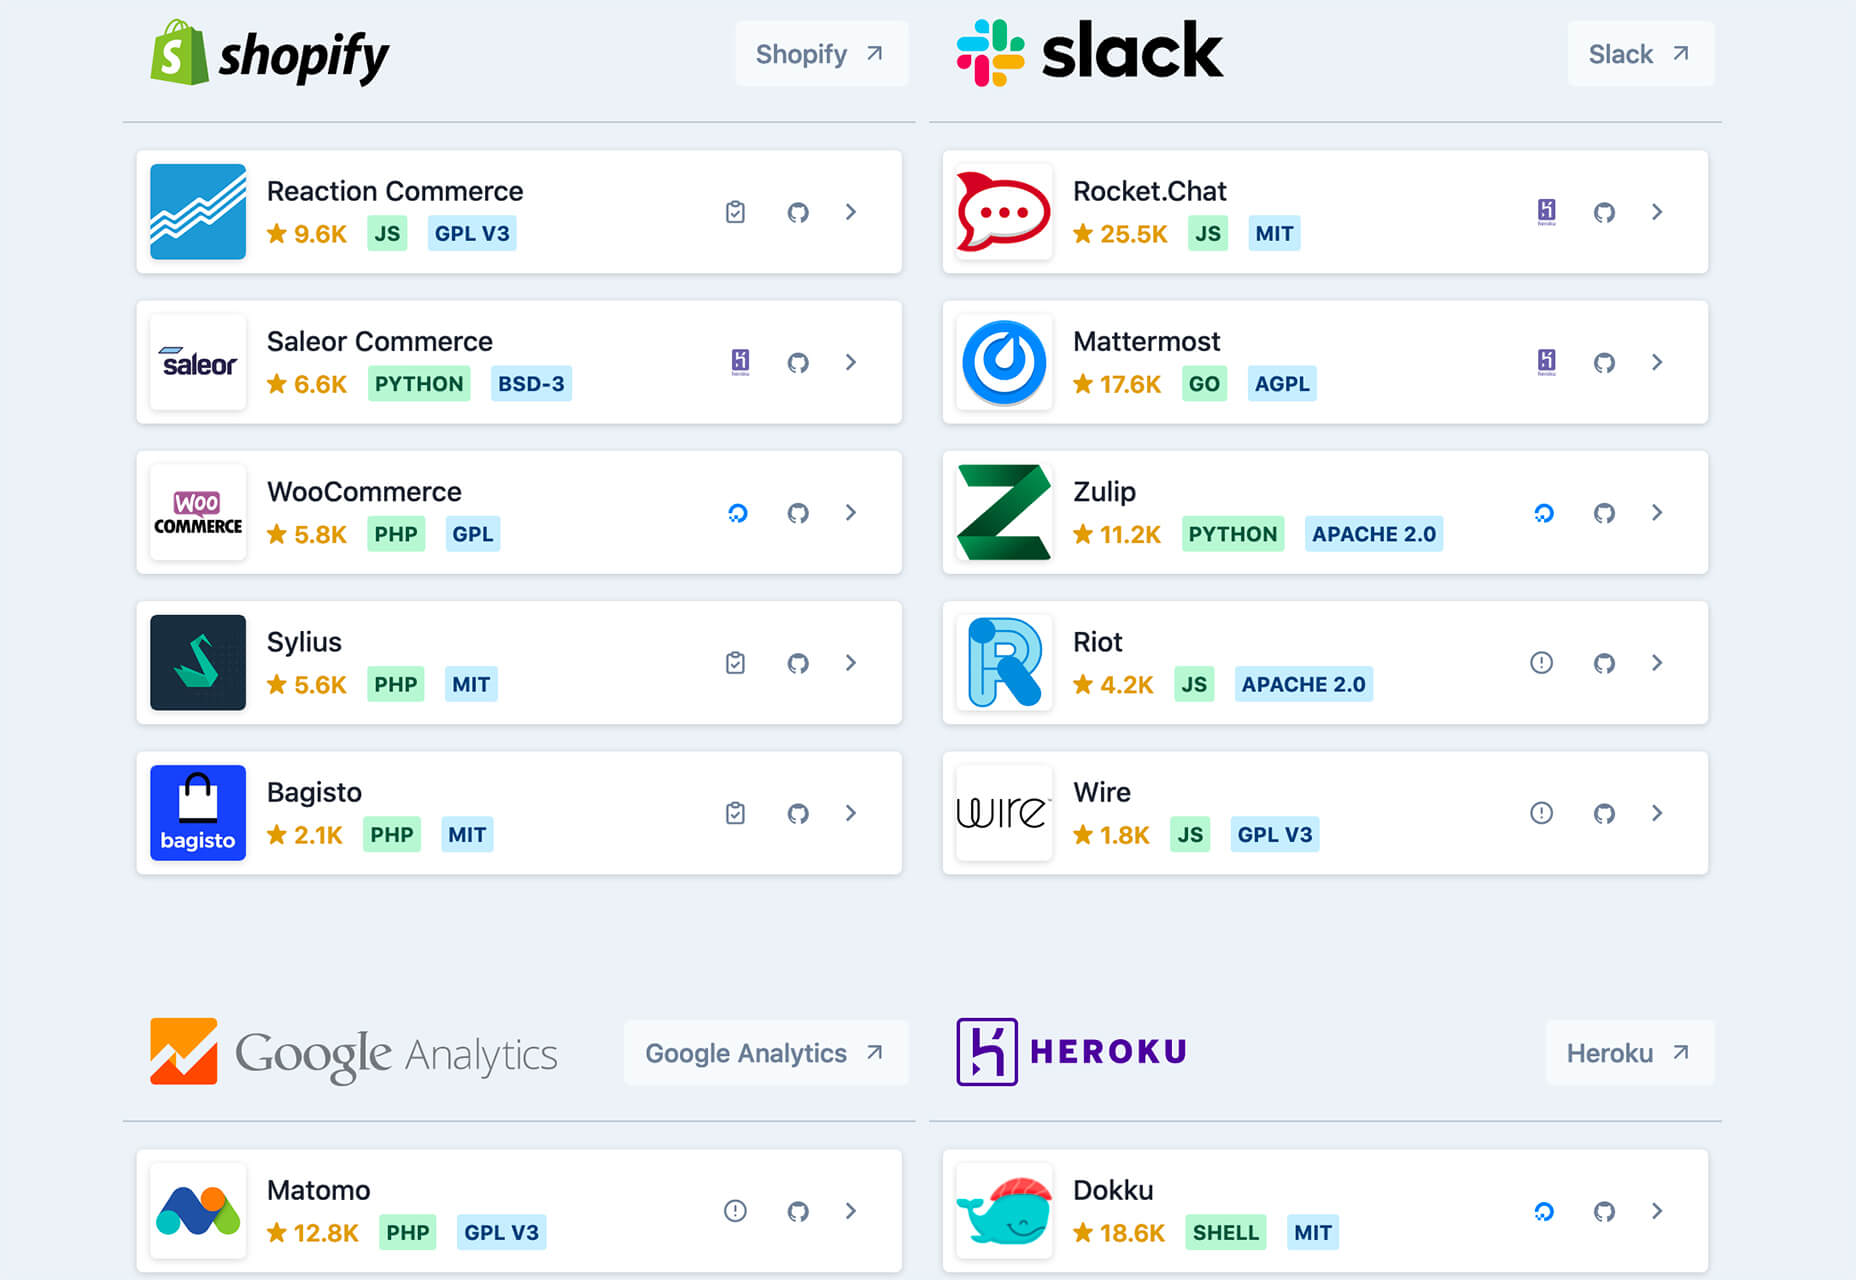
Looking for an alternative to a certain app? Opensource Builders is a collection of open-source tools with similar functionality.

Unscreen

Unscreen will remove the background of videos automatically. You can record footage anywhere – even without a green screen – and use the tool to scrub the background to an invisible layer and then add your own background element. The tool is free and also includes a pro version (coming soon) with more features.

Beastnotes

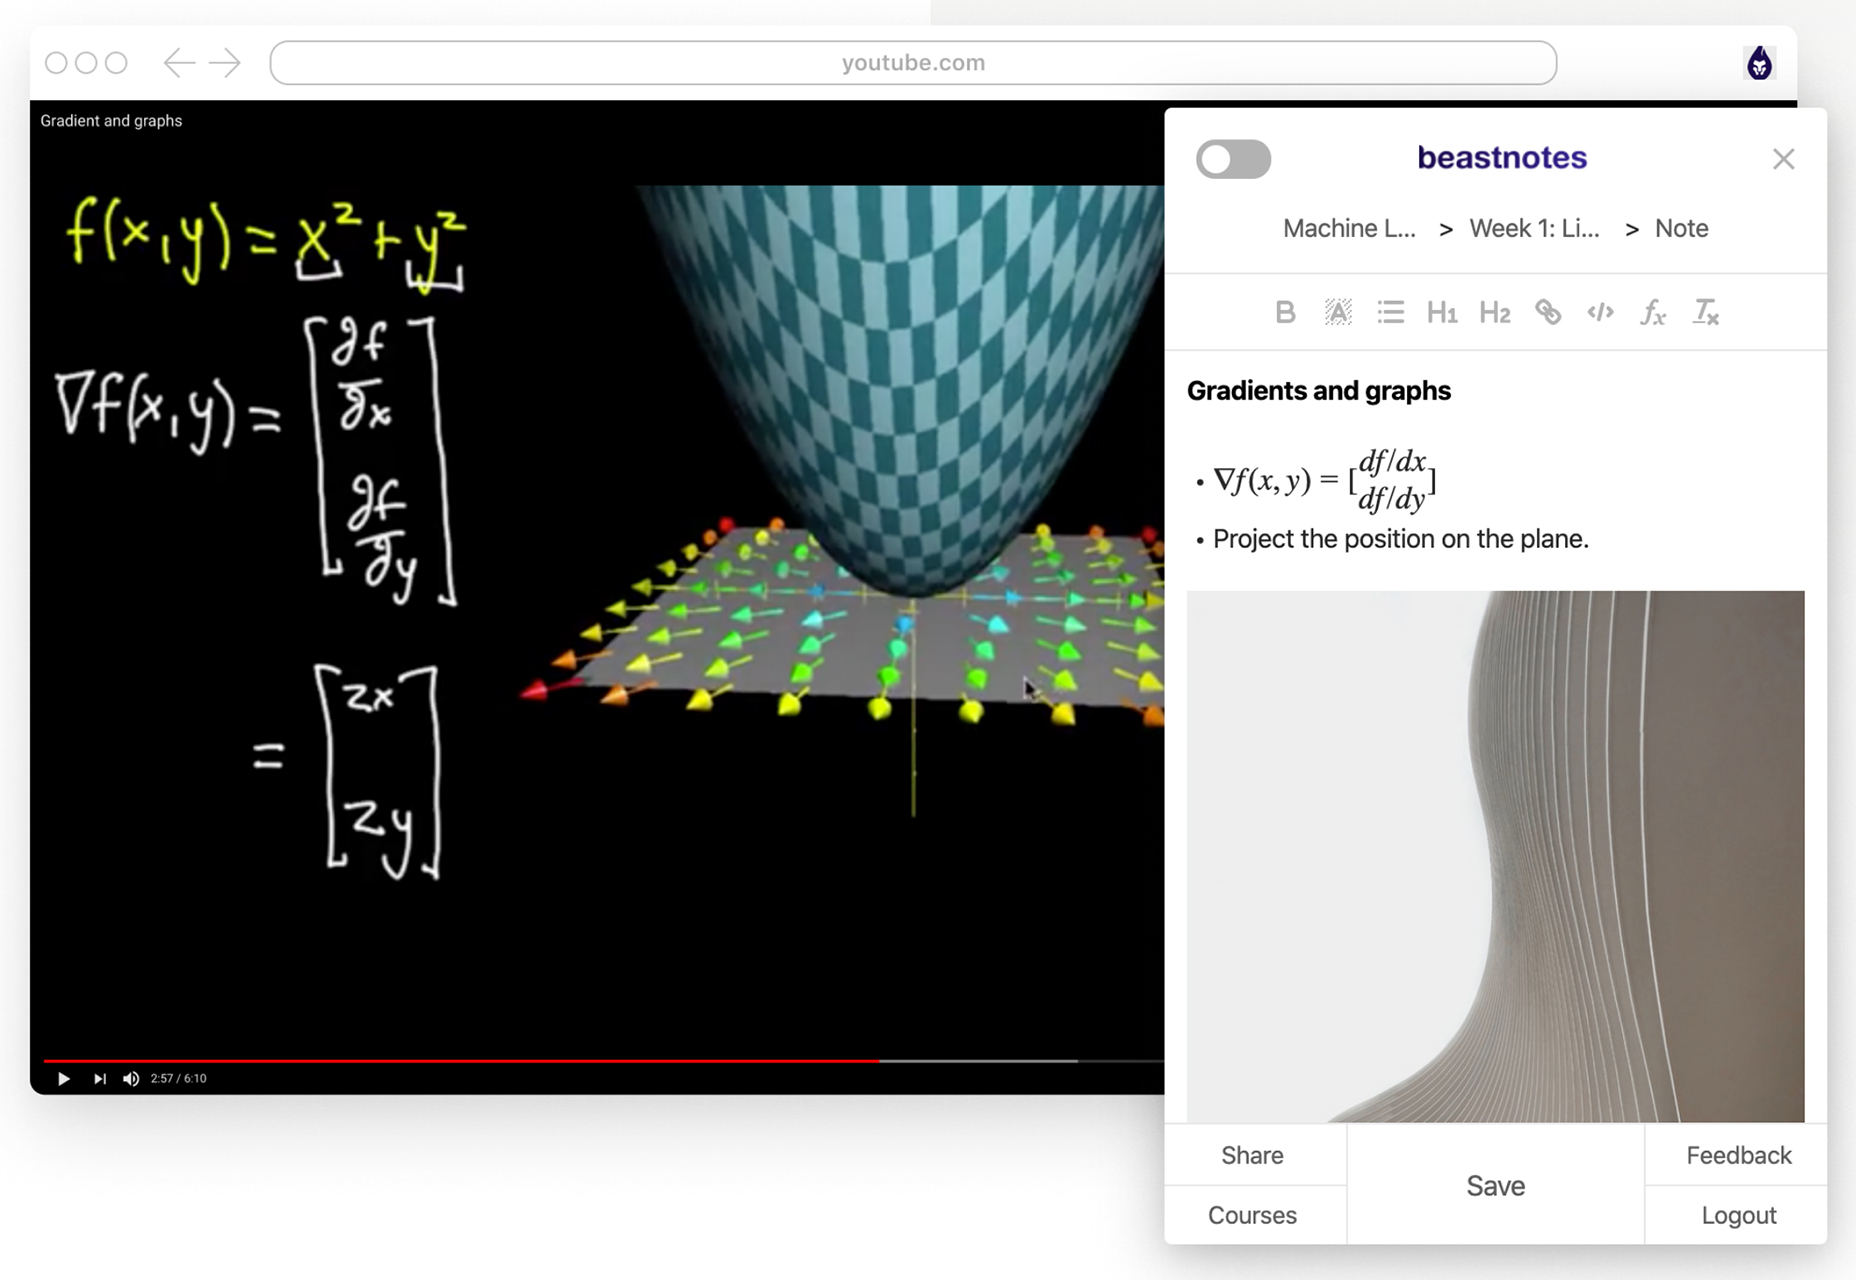
Beastnotes is designed for students taking online courses. The tool allows you to efficiently capture notes while watching video lectures with the browser extension. Then use the site to revise and study for exams. The best part? You don’t have to try to decipher your handwriting later.

Iconset

Iconset can help you save time searching for icons on your computer. The tool is a free SVG icon organizer that works on Mac and Windows operating systems. It features a drag and drop interface and can be sync for team use. You can even create and publish your own icons sets and find everything using a super-fast search tool.

Svelte-Grid

Svelte-Grid is a draggable and resizable grid layout with responsive breakpoints. And you guessed it, this tool is for Svelte.

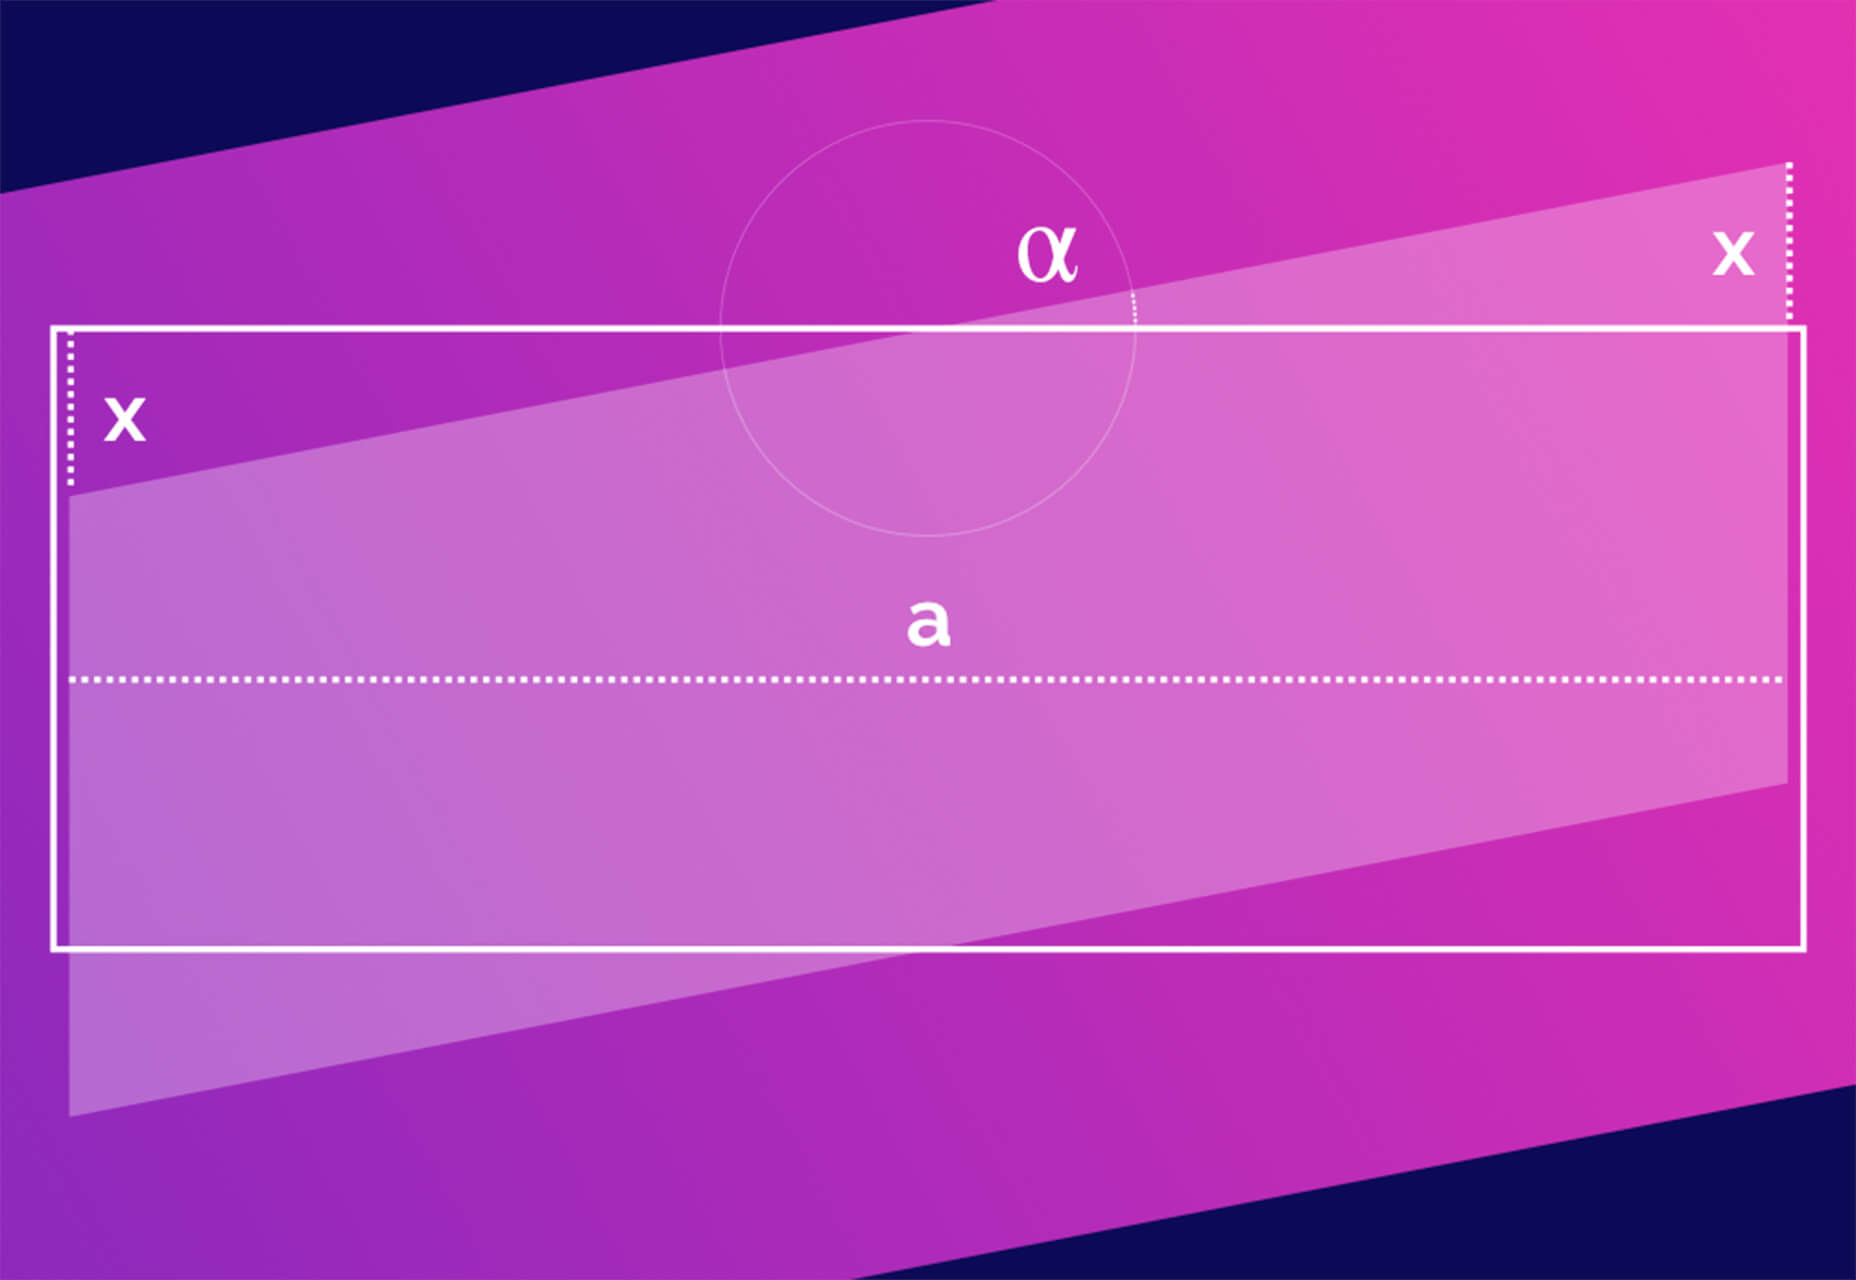
Masked and Layered Linear Gradients

Here’s a pen you’ll want to play with. Masked and Layered Linear Gradients is a neat look behind the curtain of how a cool background gradient swatch comes together.

Neumorphism.io

Neumorphism.io is a generator to create the CSS for the soft UI style that seems to be popping up everywhere. Change the colors, size, and more to get just the design you are looking for in the neumorphic style.

Glitch Art Generator

Glitch Art Generator helps you create a glitch background effect and download the file once you get it right. Adjust colors, number of glitches, location, direction, and corner effects.

Android Phone Mockups

If you are looking for an Android phone mockup, you’re in luck. This set includes eight mockup templates so you can showcase designs in a realistic environment.

Heroicons

Heroicons is a free MIT-licensed set of SVG icons for web projects. The set includes two styles – outline and solid – with 140 icons each.

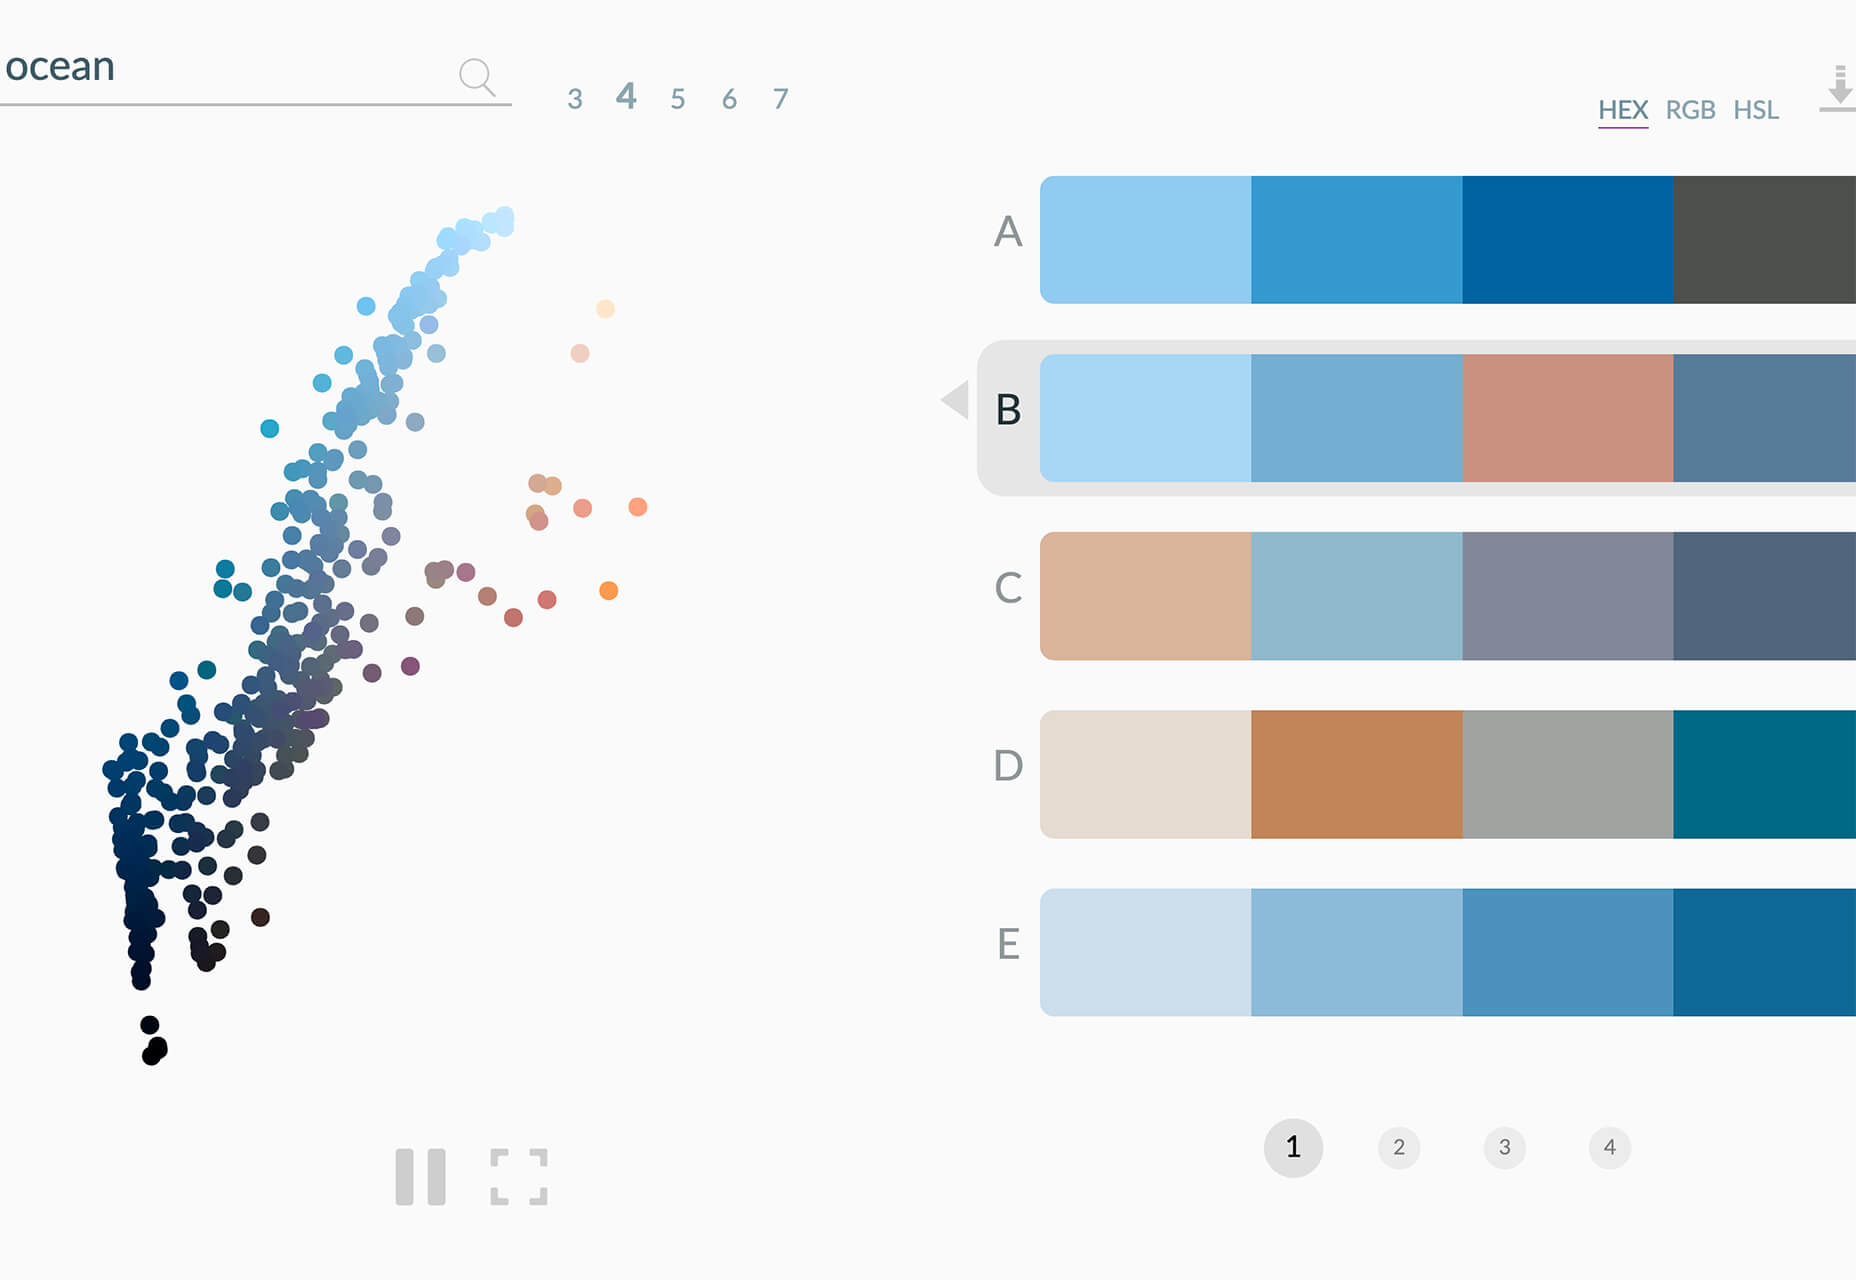
Vangogh

Vangogh is a color palette generator that uses machine learning to generate color combinations based on a search term. Each query – such as winter or sunset – returns four themes with five palettes each. You can also pull palettes from images. Every palette comes with downloadable color codes.

Cutt.ly

Cutt.ly is a URL shortner that allows you to create branded short links and track everything in an analytics dashboard. It also includes a browser toolbar shortcut for super-fast link shortening.

Care Bear Needs Love

Care Bear Needs Love is just a fun little project by Jhey. Click the mouse to start (We won’t spoil the surprise; you should go visit for yourself.)

Create Diagonal Layouts

Did you know you can build diagonal layouts with CSS? This tutorial by Nils Binder includes markup and tips to make easy work of something that looks cool and complicated.

Stacking Cards Effect

This tutorial takes your through creating a trendy stacking cards effect using the CSS sticky position and the Intersection Observer API. It includes a demo and downloads to make the most of this simple lesson.

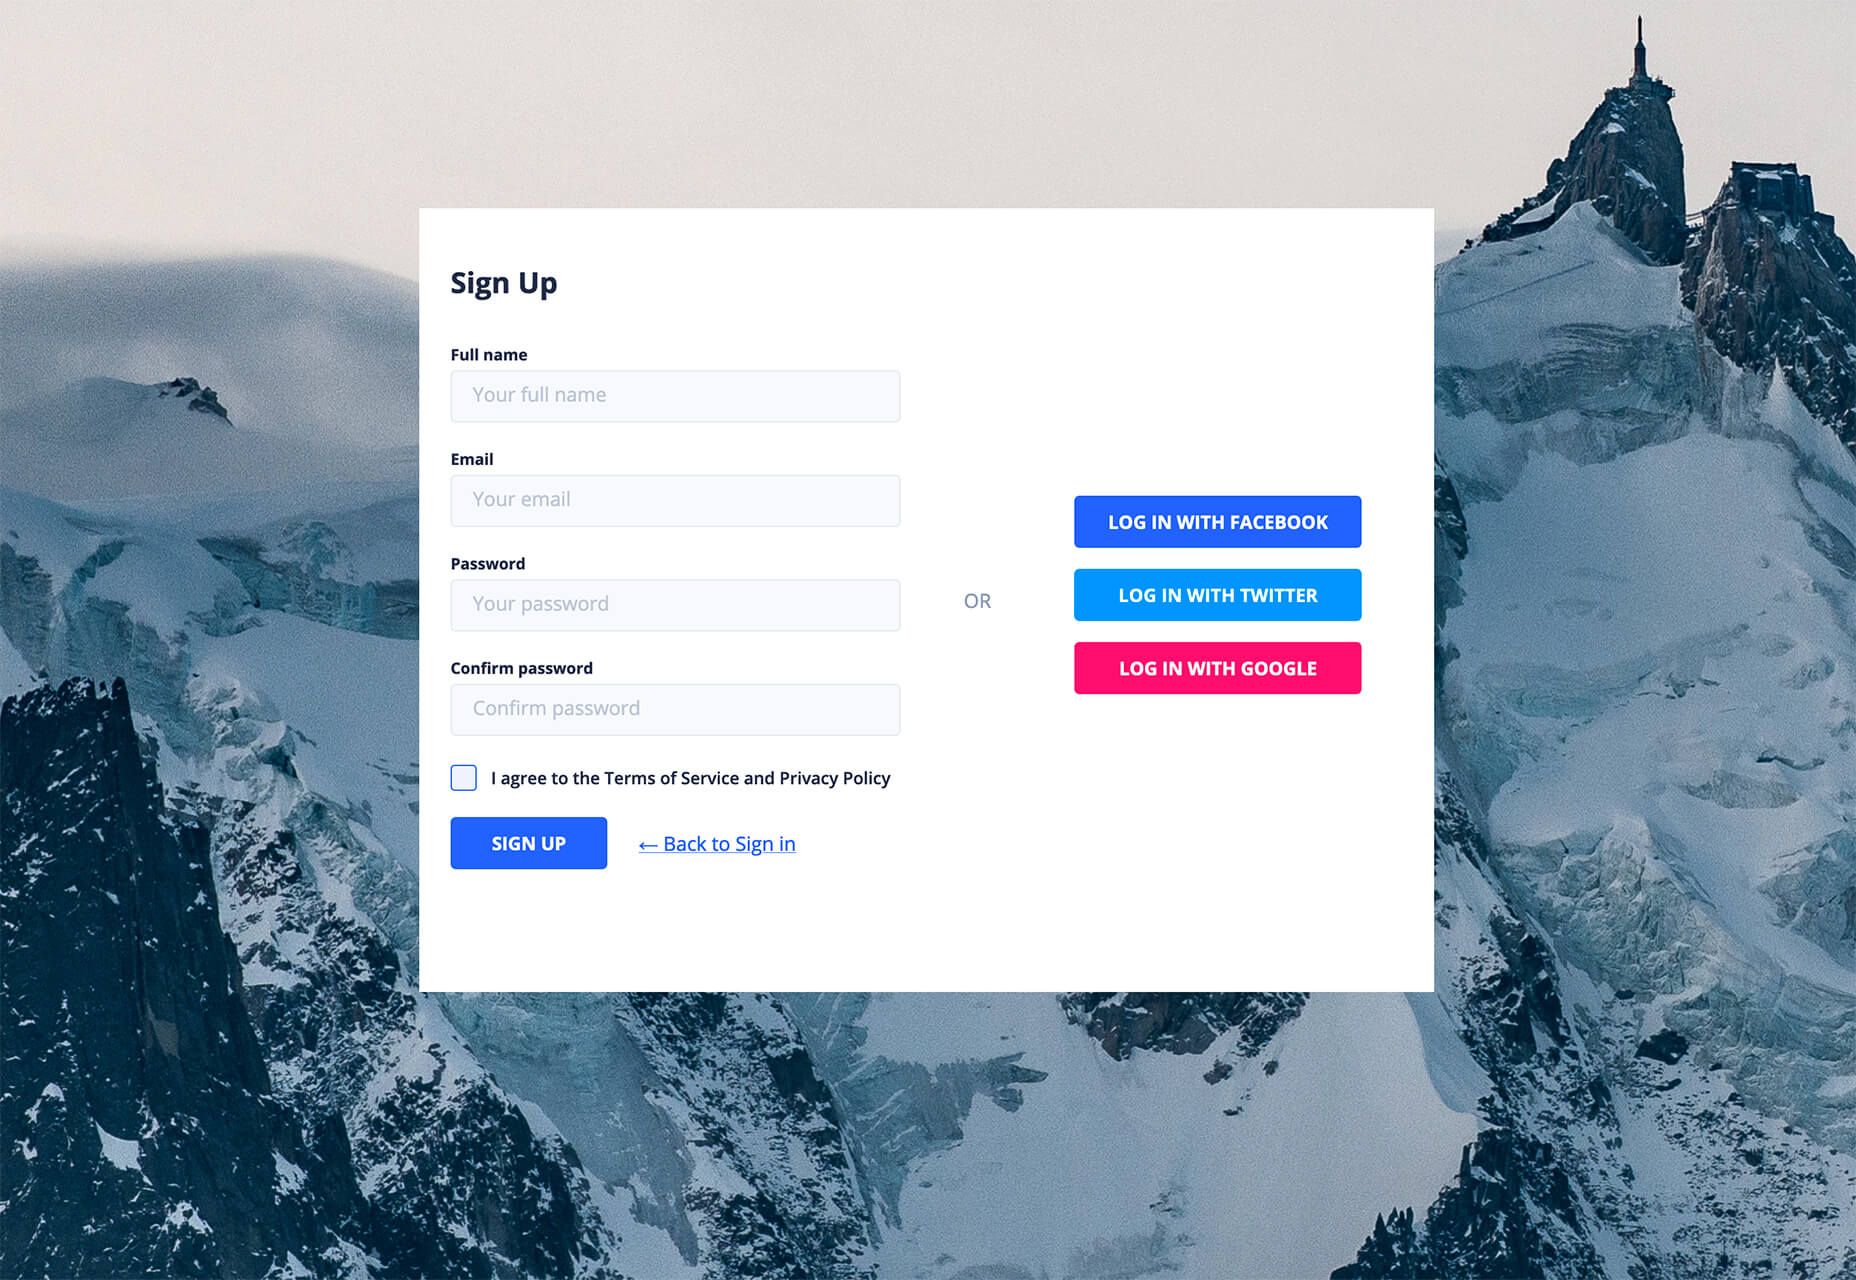
Signup Form Generator

Use visual tools to create a sign-up form in three steps and for free. Choose the template you like, fill in the fields, select a color. Download the form and its Angular code, or customize it in UI Bakery.

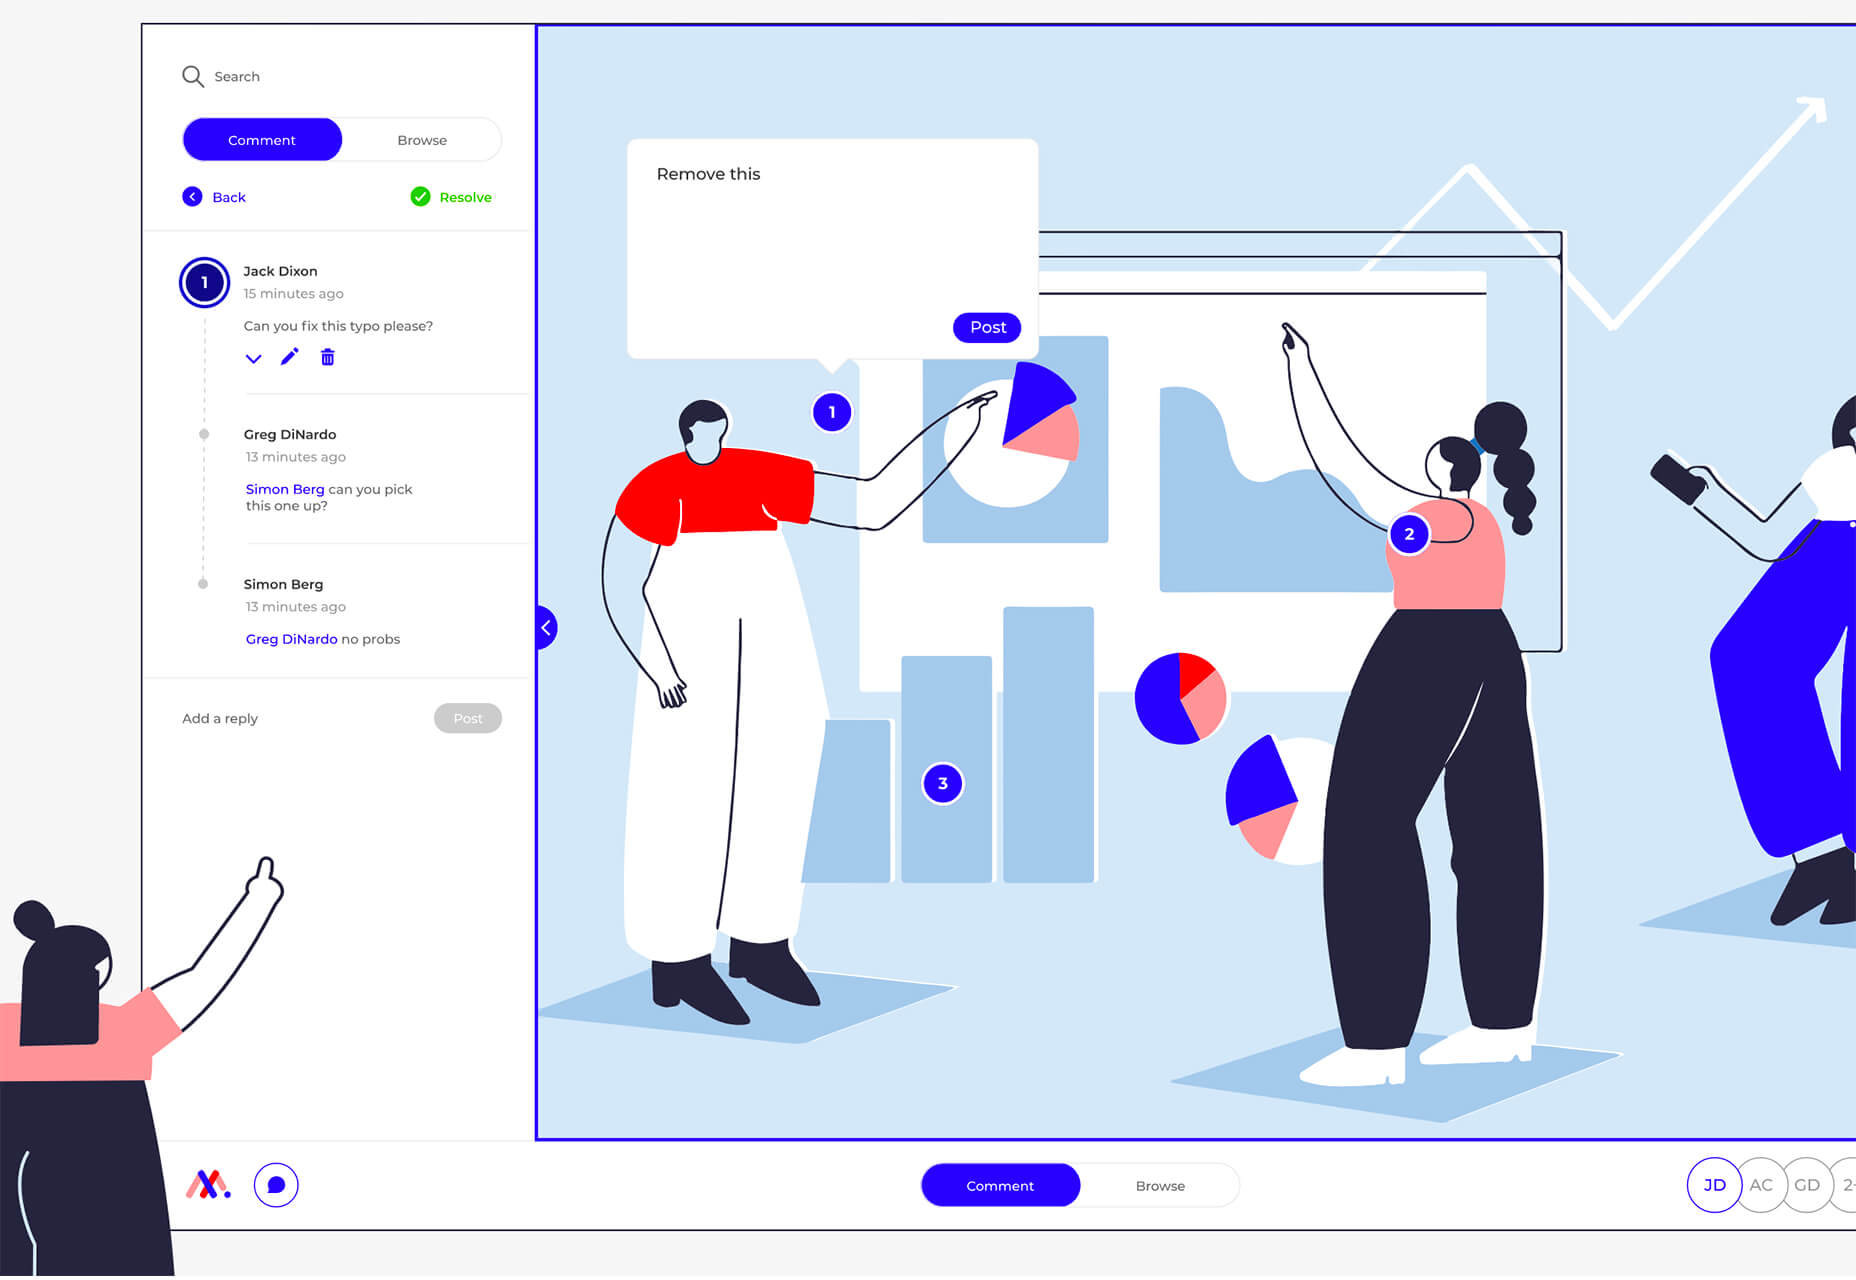
MarkUp

MarkUp lets your turn your website (or concept design) into a canvas for feedback and collaboration. Real-time commenting can help you get projects done faster and know exactly what pain points there might be with the design. You can have an unlimited number of projects, collaborators, and comments for free.

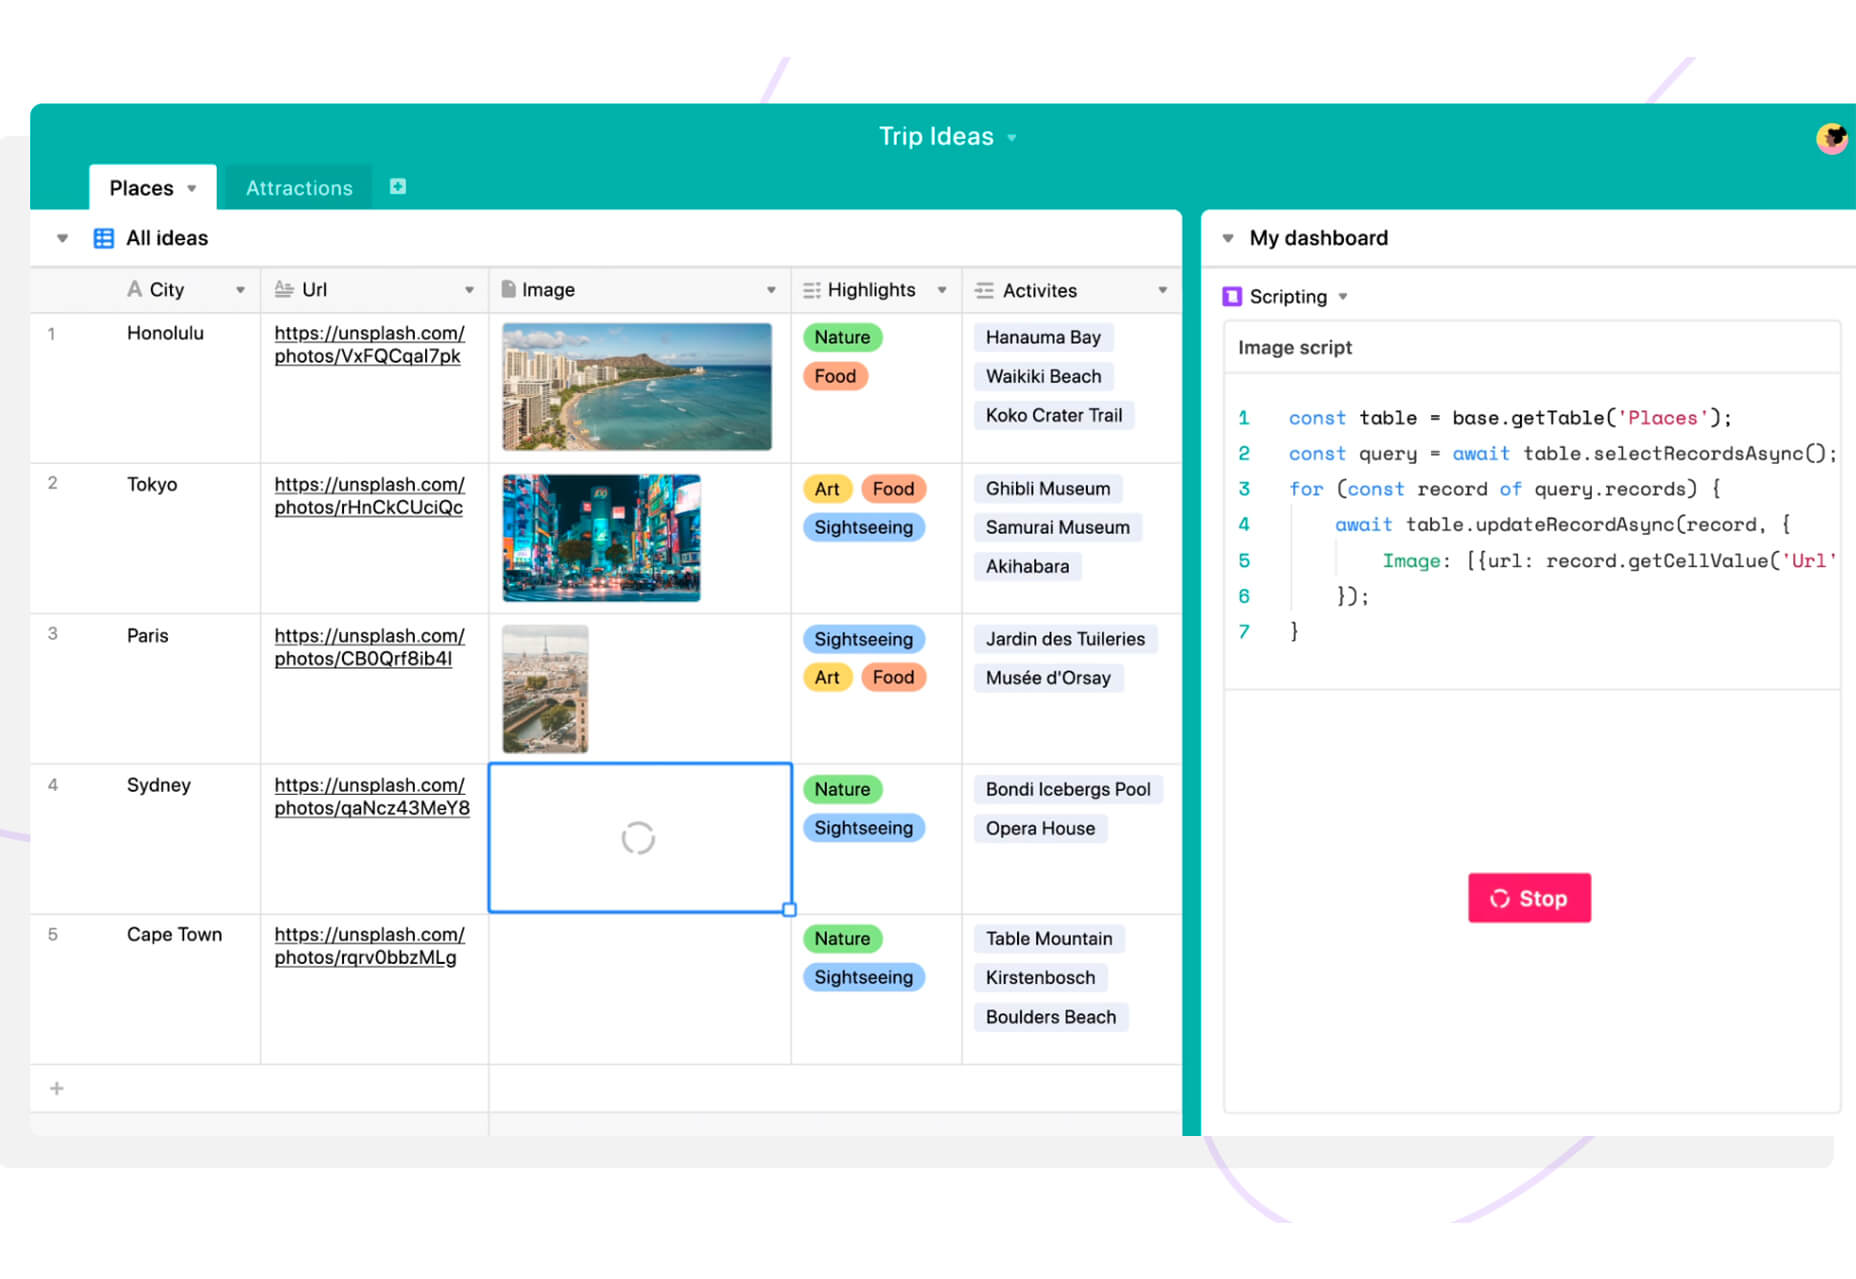
Airtable Scripting Block

Airable users will appreciate this — a new scripting block that allows you to write, edit, and run short scripts right inside the tool. Plus, it’s all hosted within Airtable.

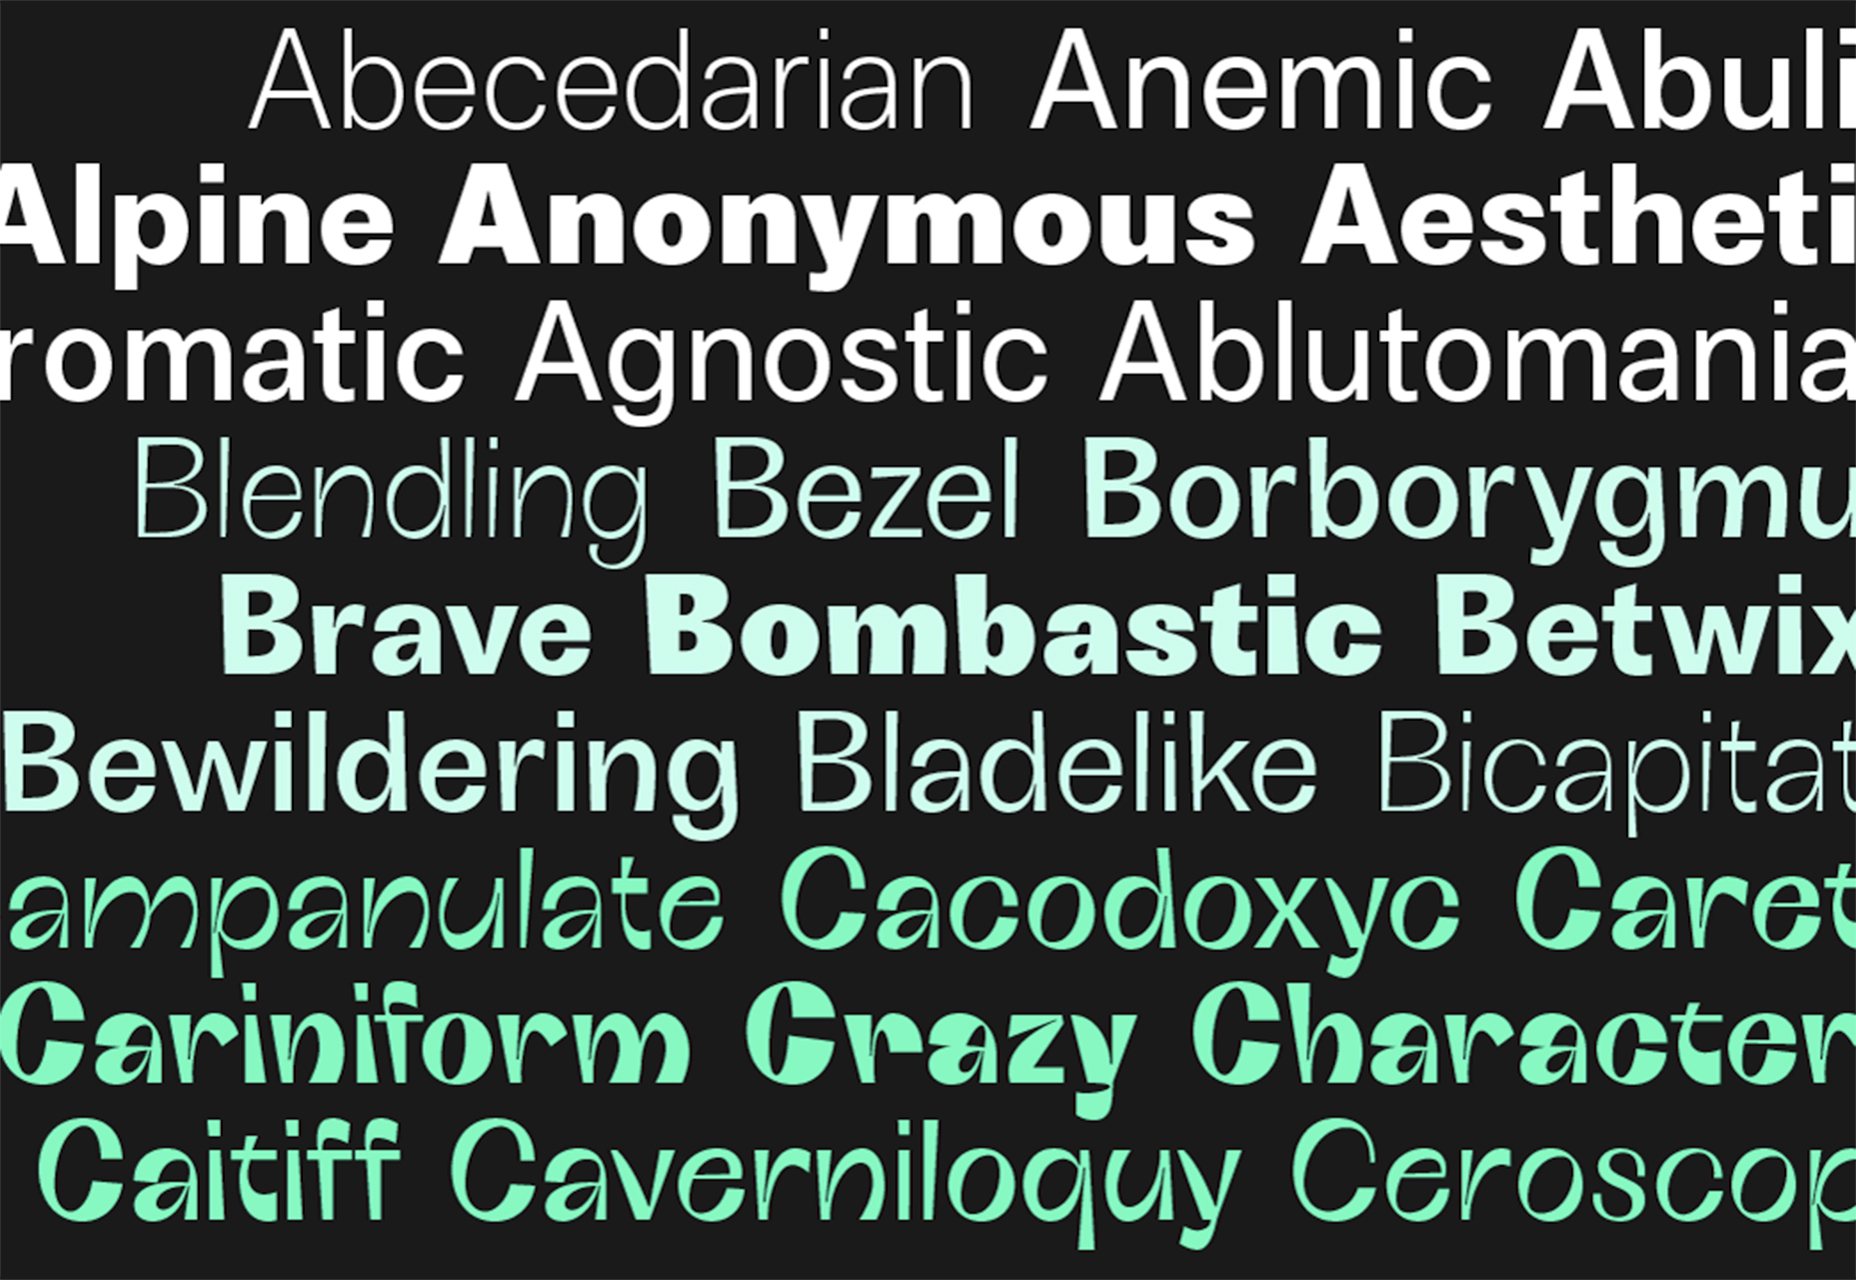
Boring Sans B

Boring Sans B (there’s also an A) is a typeface family designed along two variable axes, weight and weirdness. These parameters allow designers to explore a full range of variations on sans serif design, starting from a neutral set of proportions and evolving to a strongly contrasted and dynamic treatment.

Deep Shadow

Deep Shadow is a slab typeface that creates the expected effect from its name. It uses layering to create the effect and does have some instructions for use.

Holla Hearth

Holla Hearth is an elegant brush script that makes a beautiful display typeface. The demo is somewhat limited, but a full version of the typeface is available.

Manti Slab

Manti Slab is a good choice if you want to make a statement with typography. Regular, Light, and Black weights are highly readable. The demo includes a limited character set and there is a full version available.

Stanley

Stanley combines unexpected things: Ligatures and a stencil style. The characters are interesting and have a lot of character.

Street Photography

Street Photography is a typeface with a handwriting style that is easy to use. It includes upper and lowercase characters but is otherwise limited.

Source

Categories: Designing, Others Tags:

7 Best WordPress Blogs to Follow in 2020

March 16th, 2020 No comments

WordPress has a huge community that is rapidly growing. Whether you run a blog or business, you can always stay up to date and get help from people.

Let’s say you are creating your first website and have the least knowledge of WordPress or its environment. You may want to customize your theme or plugin or modify something on your site. But, how would you do?

Well, it’s very easy. Tanks to the WordPress community.

There are over hundreds of WordPress as well as WooCommerce blogs available that provide free resources so that you can grow your site and business.

That’s why we handpicked 7 WordPress blogs that you can follow in 2020.

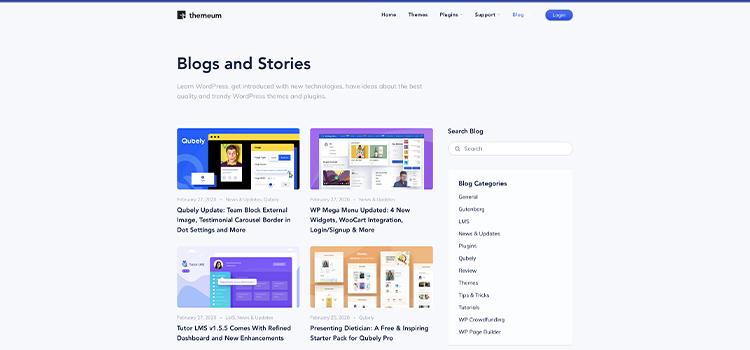
Themeum

Themeum is a state of the art WordPress theme and plugin development company. The company hopes to make the web a better place with WordPress, amidst a keen focus on small businesses and individuals.

Themeum’s blog provides visitors with frequent updates of the WordPress community along with quick-start guides and tutorials. Themeum’s flagship products, Tutor LMS and Qubely are fan-favorite plugins.

These products get regular update posts as well as use-case tutorials. Their blog posts are well-written and cater to everyone involved in the WordPress community. The articles in the blog are informative, well-written, and can be followed by anyone from a beginner to an expert.

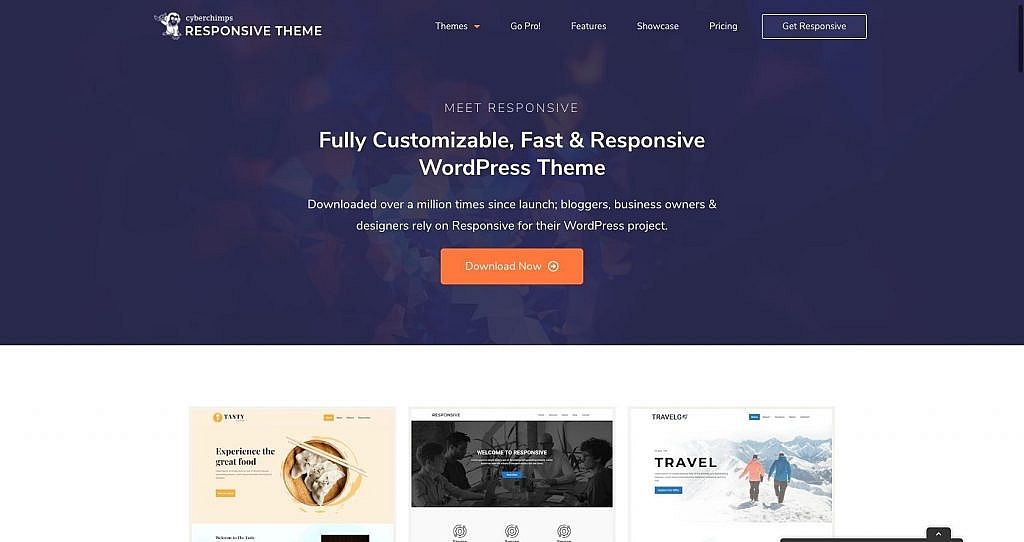
CyberChimps

CyberChimps blog may serve as your encyclopedia for the latest WordPress themes and plugins in the market. It will not just provide you with lots of collections of different types of themes with an overview of their features but also give you an idea about how to use them. If you are interested in any theme, the blogs will direct you to a landing page where you can directly purchase the theme or add it cart for a later purchasing decision.

You will also get experts’ views on the latest WordPress related topics like beginners’ guide or theme comparison. You can easily use it as a free tutorial for WordPress. You may also get tips and insight on digital marketing to boost up your business.

CompeteThemes

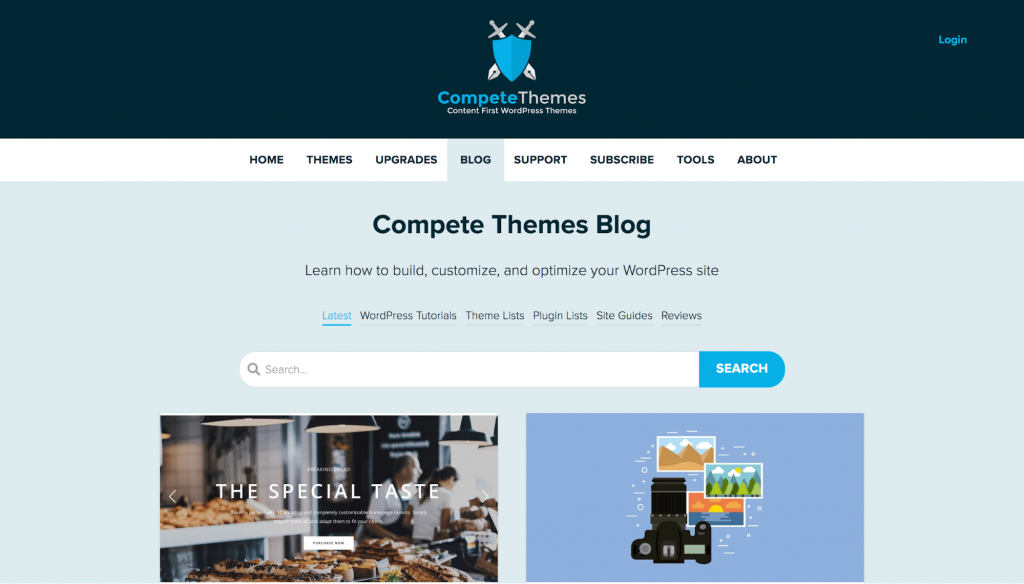
The Compete Themes blog will teach you how to build, customize, and optimize WordPress websites. You’ll find detailed guides on how to replicate popular websites from scratch, curated lists recommending the best themes and plugins, and some of the most thorough WordPress tutorials on the web.

Make sure to check out their guide on customization WordPress, in particular, which has 31 different ways to customize the appearance and functionality of your WordPress website.

WPBlog

WPblog is a WordPress resource website where they publish amazing WordPress tutorials, honest reviews, in-depth comparisons, and insightful interviews from popular WordPress personalities. They are relatively new in the WordPress community but their consistency and conviction to educated the WordPress community have quickly made them popular among WordPress users.

What makes WPblog different is the fact that they produce content for the next generation. WordPress users now want to build their sites using drag and drop functionalities. These people don’t want to read lengthy, boring tutorials. WPblog aims to inject fun in WordPress so that visitors enjoy reading their content.

ScanWP

The Scan WP blog is the blog on the known Theme and plugin detector. They publish many posts with top theme lists, top plugin posts, FAQs, WordPress code snippets, tutorials for beginners (for example this posts about how to start a blog) and pros (like their popular post about building a WordPress theme from scratch, using nothing but code), tips for doing SEO on WordPress sites and much more. There are hundreds of posts on the blog for you to enjoy and learn more about WP, regardless of your level of experience.

MuffinGroup blog

The MuffinGroup blog offers through its articles tips, tricks and all of the stuff you should know about WordPress and web design. You can check their latest article on how to embed Google reviews on your site.

wpDataTables blog

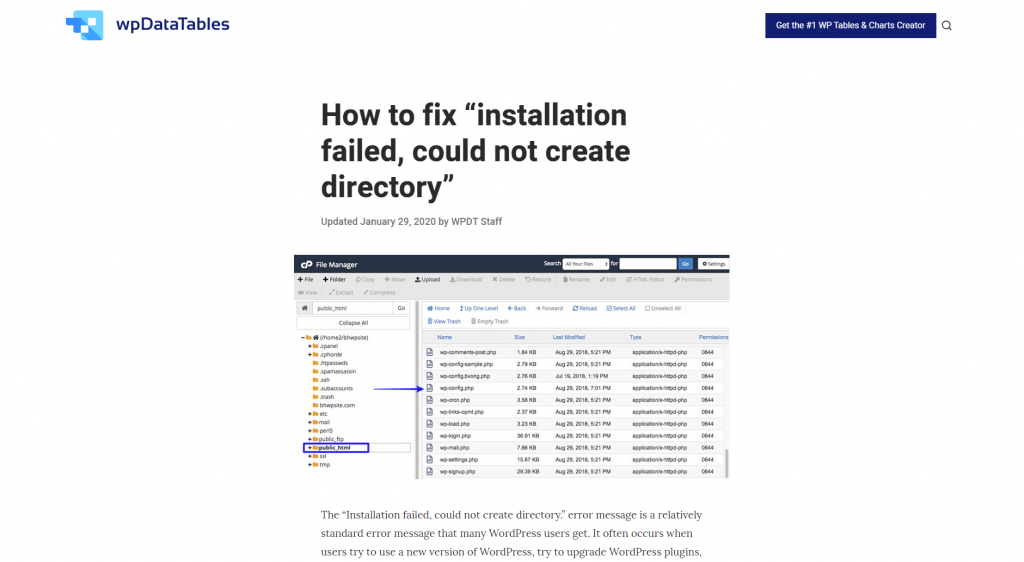
The wpDataTables blog is a simple and efficient blog, with no ads and shiny graphics. It focuses on WordPress and web dev articles that keep WordPress developers and site owners up to date. You can check their latest article on WordPress popup plugin options.

We hope you like the list of best WordPress blog. If you ding this tutorial helpful, do share it with your friends.

Categories: Others Tags:

Using the HTML title attribute

March 15th, 2020 No comments

Steve Faulkner:

User groups not well served by use of the title attribute

• Mobile phone users.
• Keyboard only users.
• Screen magnifier users.
• Screen reader users.
• Users with fine motor skill impairments.
• Users with cognitive impairments.

Sounds like in 2020, the only useful thing the title attribute can do is label an .

Direct Link to ArticlePermalink

The post Using the HTML title attribute appeared first on CSS-Tricks.
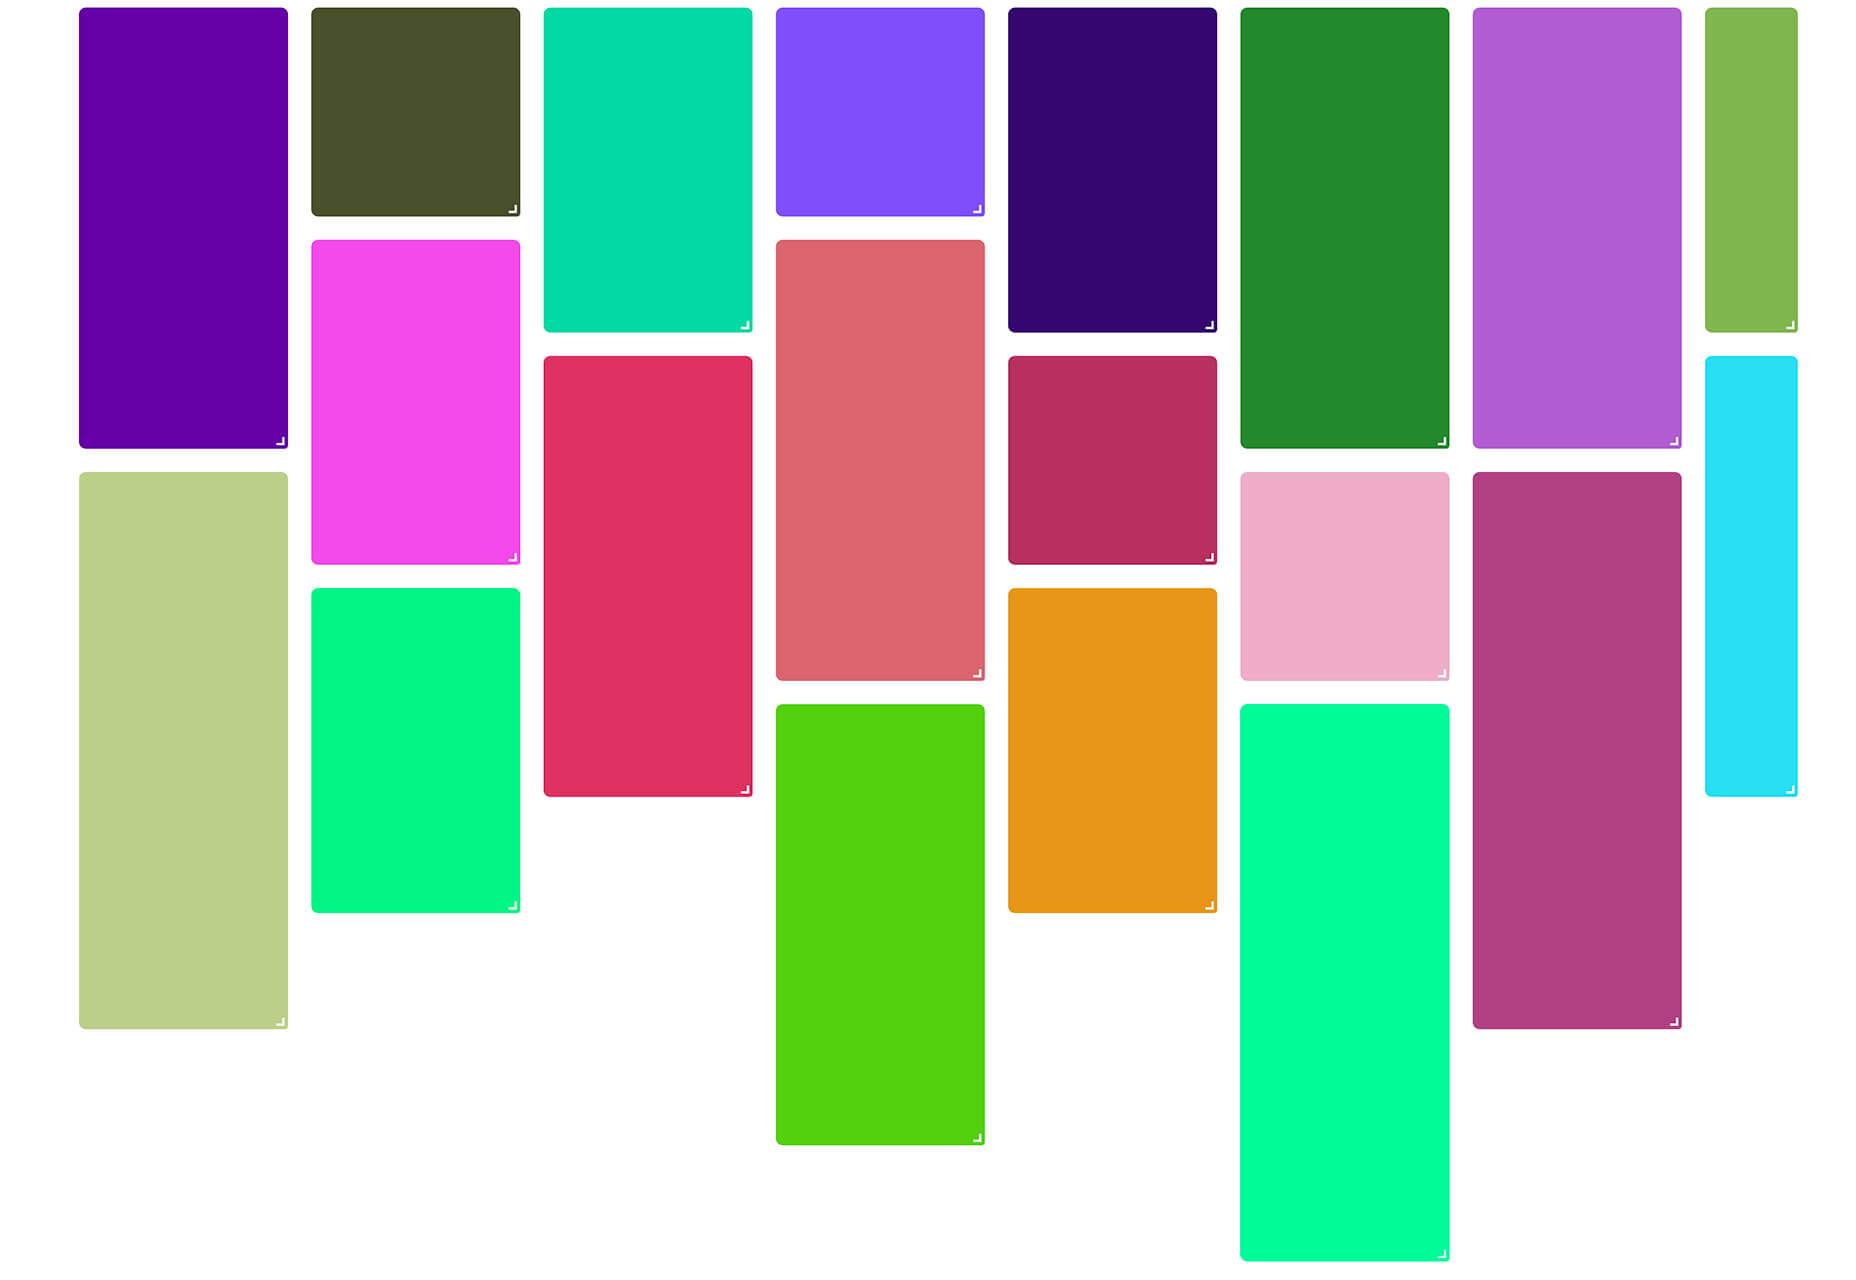
Categories: Designing, Others Tags:

Popular Design News of the Week: March 9, 2020 – March 15, 2020

March 15th, 2020 No comments

Every week users submit a lot of interesting stuff on our sister site Webdesigner News, highlighting great content from around the web that can be of interest to web designers.

The best way to keep track of all the great stories and news being posted is simply to check out the Webdesigner News site, however, in case you missed some here’s a quick and useful compilation of the most popular designer news that we curated from the past week.

Note that this is only a very small selection of the links that were posted, so don’t miss out and subscribe to our newsletter and follow the site daily for all the news.

51 CSS Background Patterns

The Worst Fonts Everyone Keeps Using

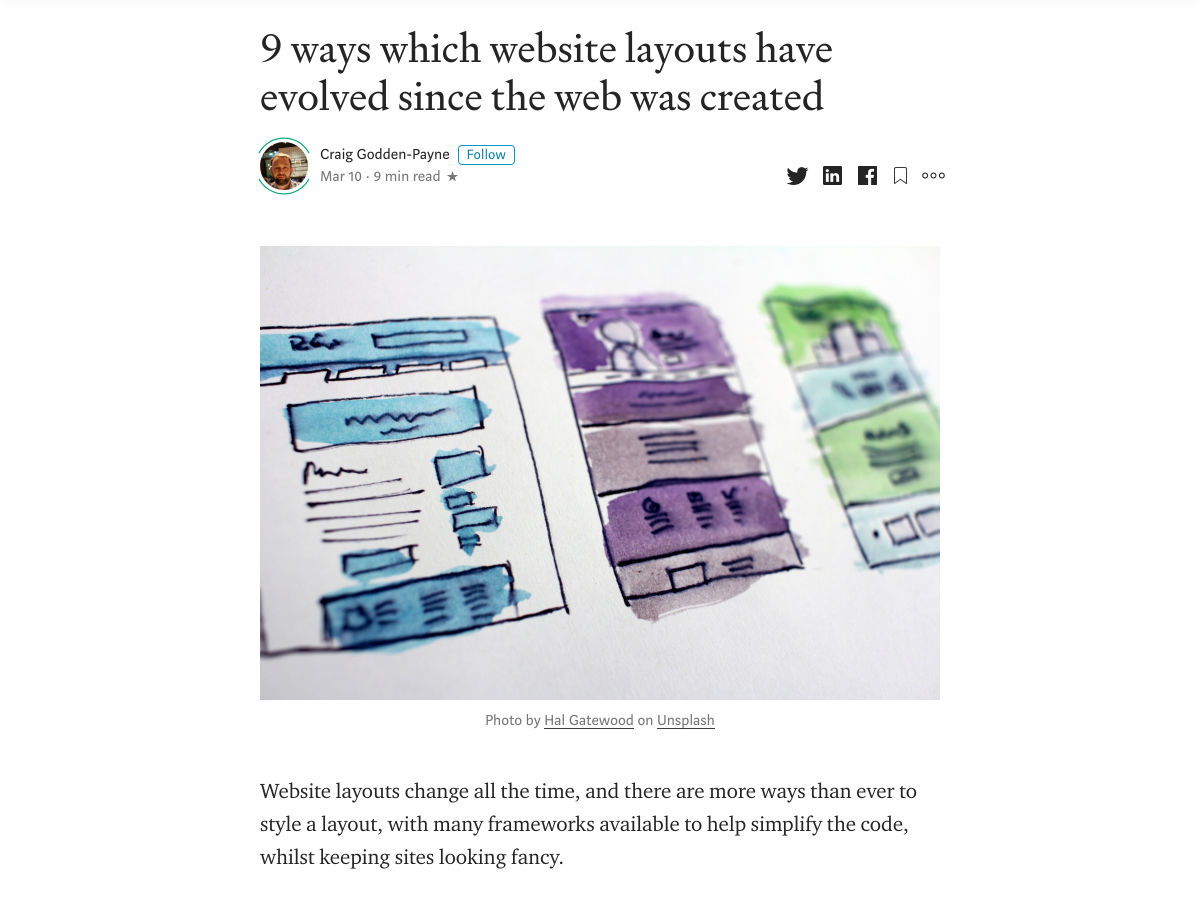
9 Ways Which Website Layouts Have Evolved

33 Examples of Highly Effective SaaS Website Designs

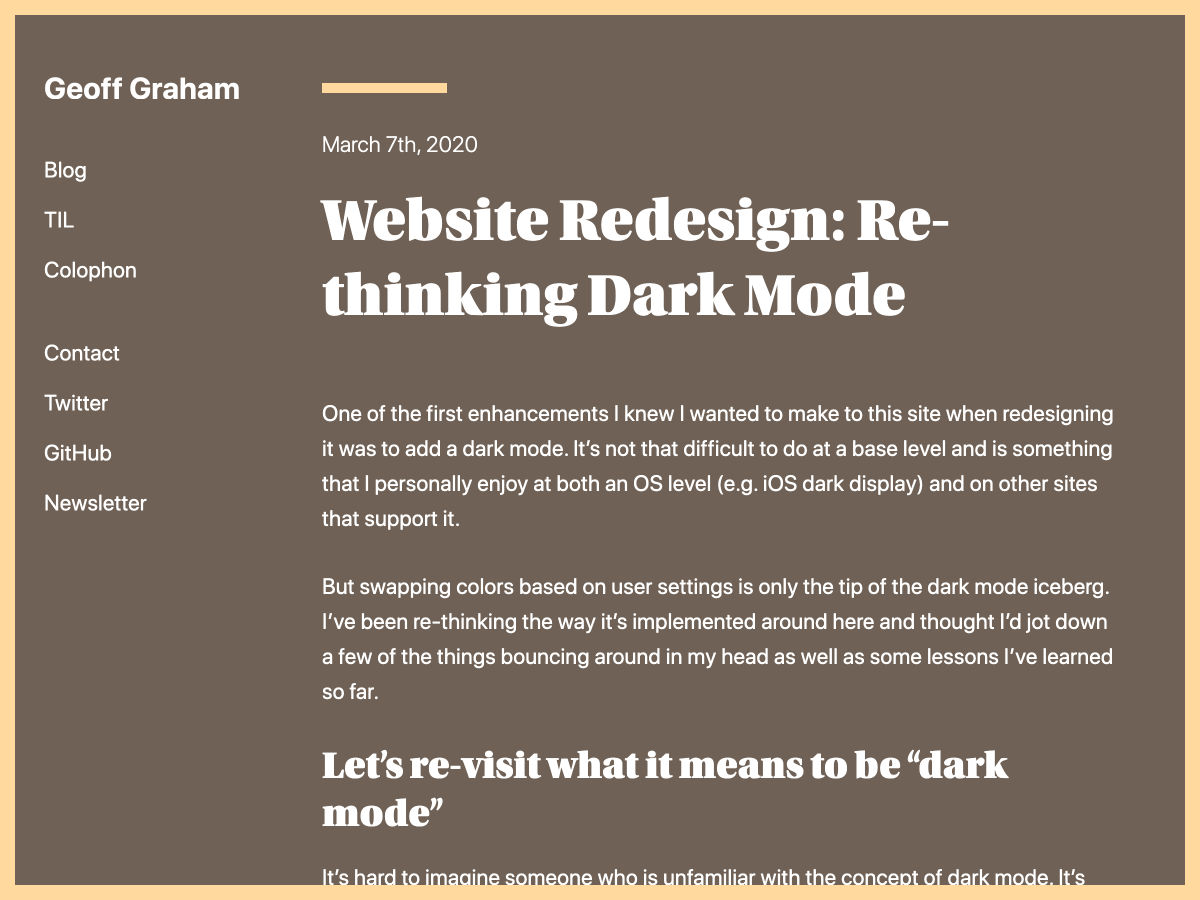
Website Redesign: Re-thinking Dark Mode

Setting Height and Width on Images is Important Again

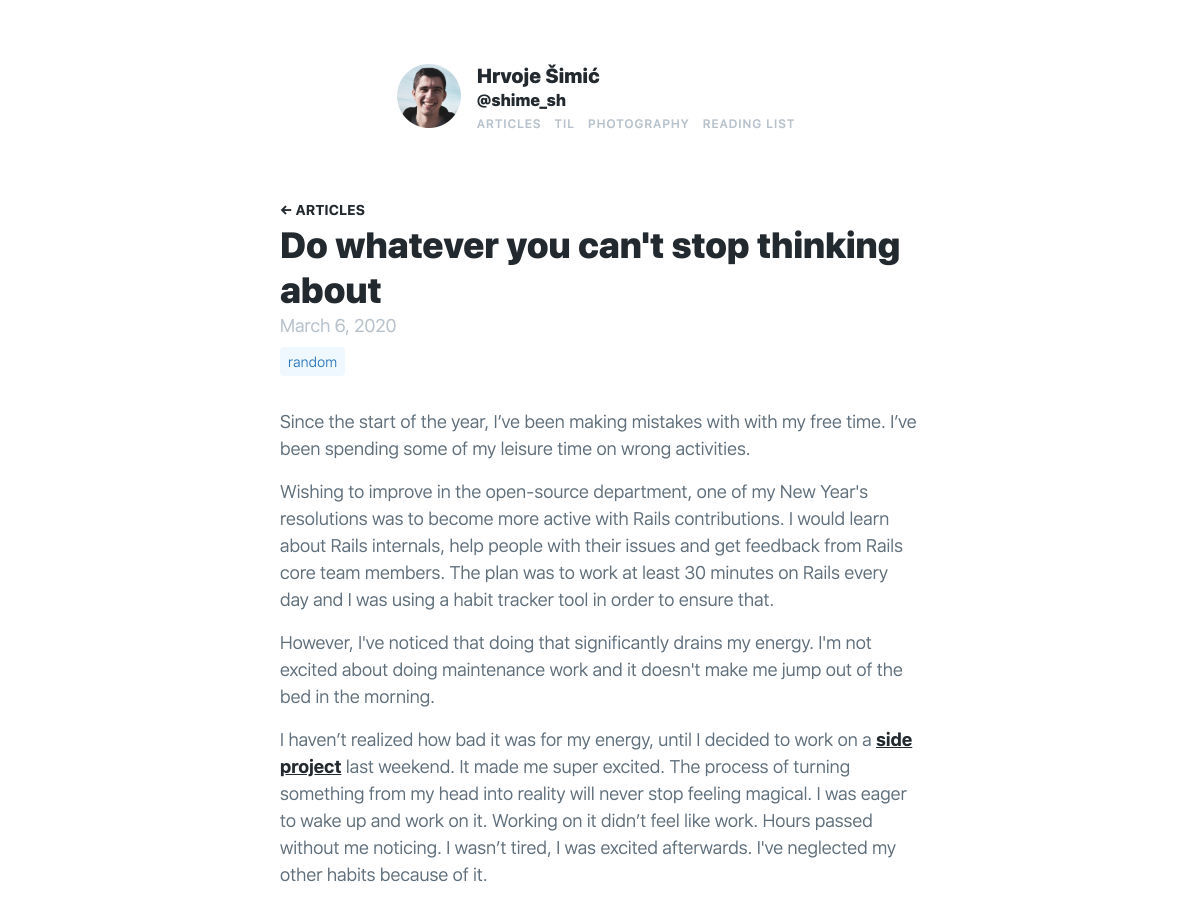
Do Whatever You Can’t Stop Thinking About

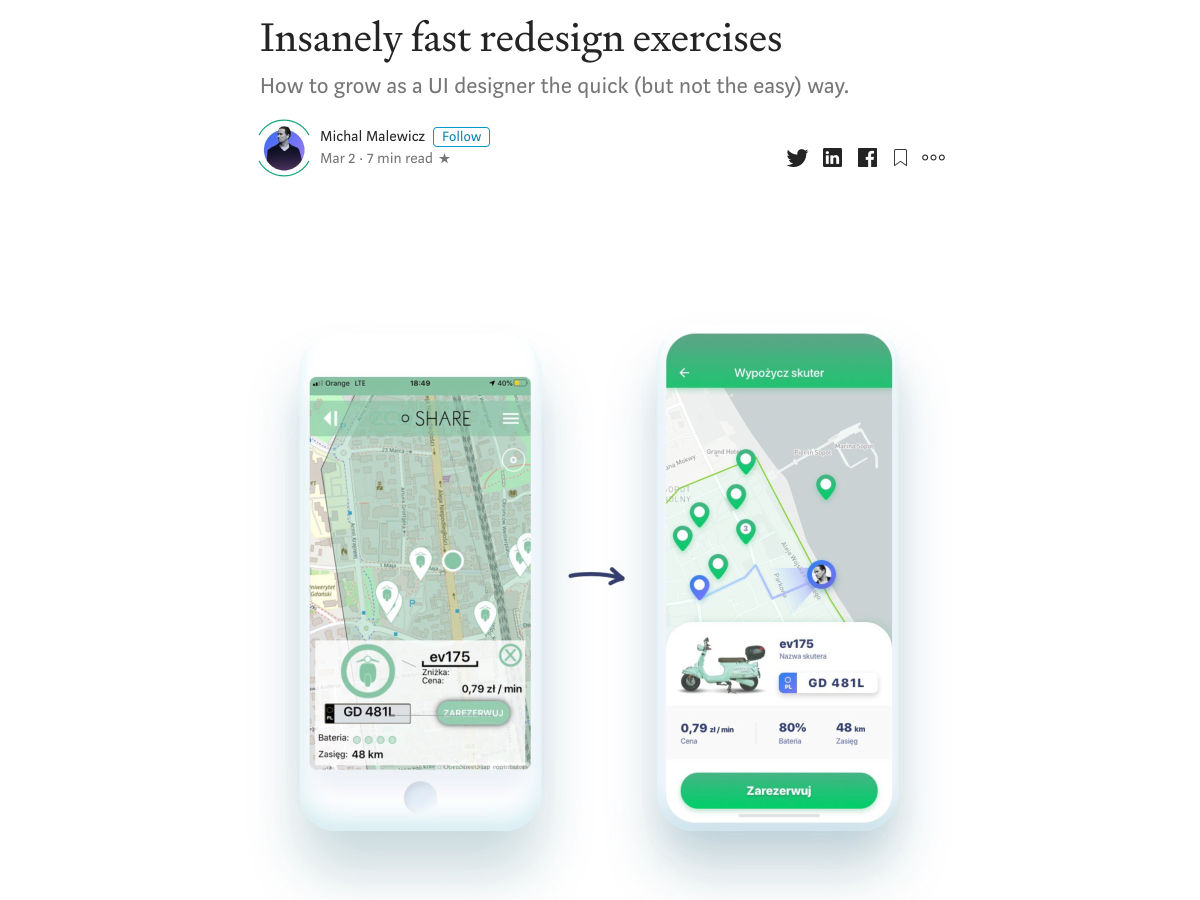
Insanely Fast Redesign Exercises

9 Things that will Help You Become a Better UX/UI Designer

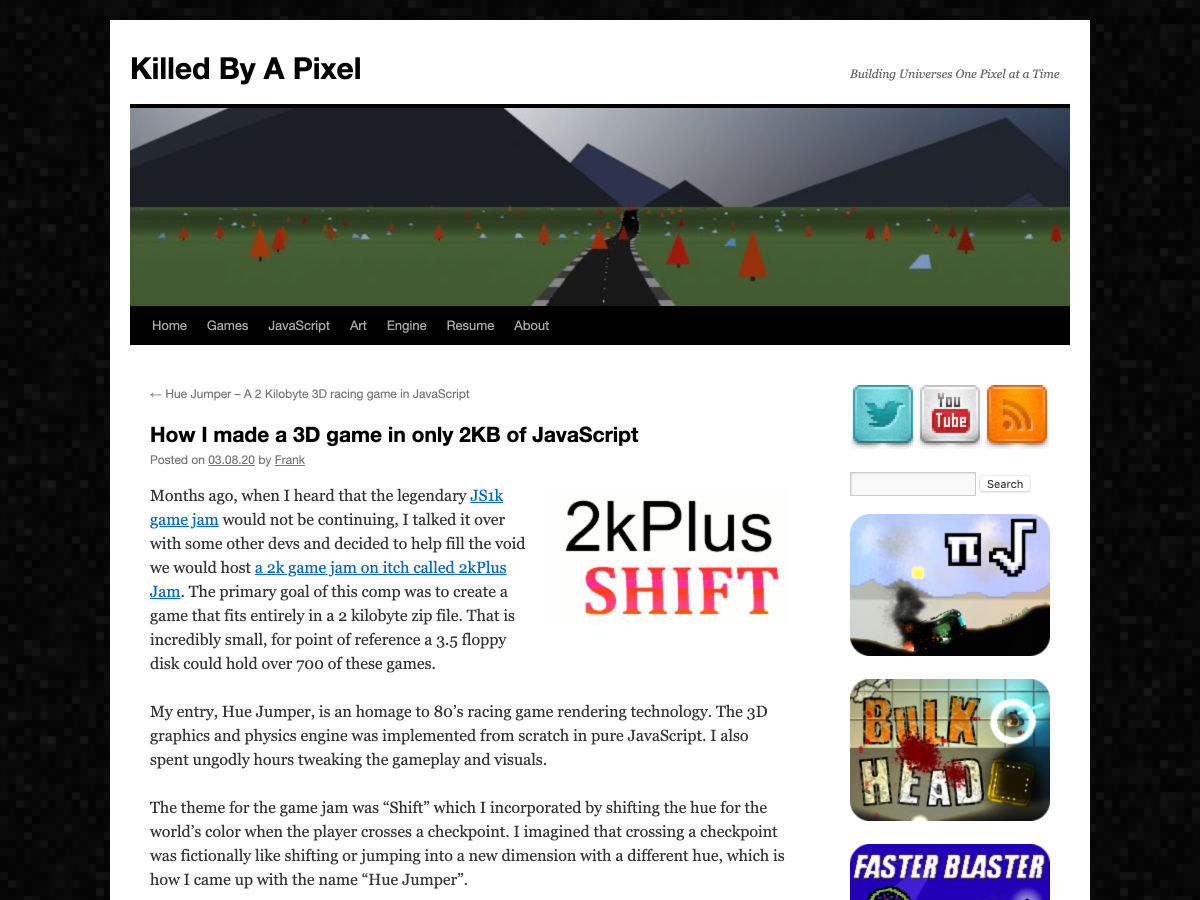
How I Made a 3D Game in Only 2KB of Javascript

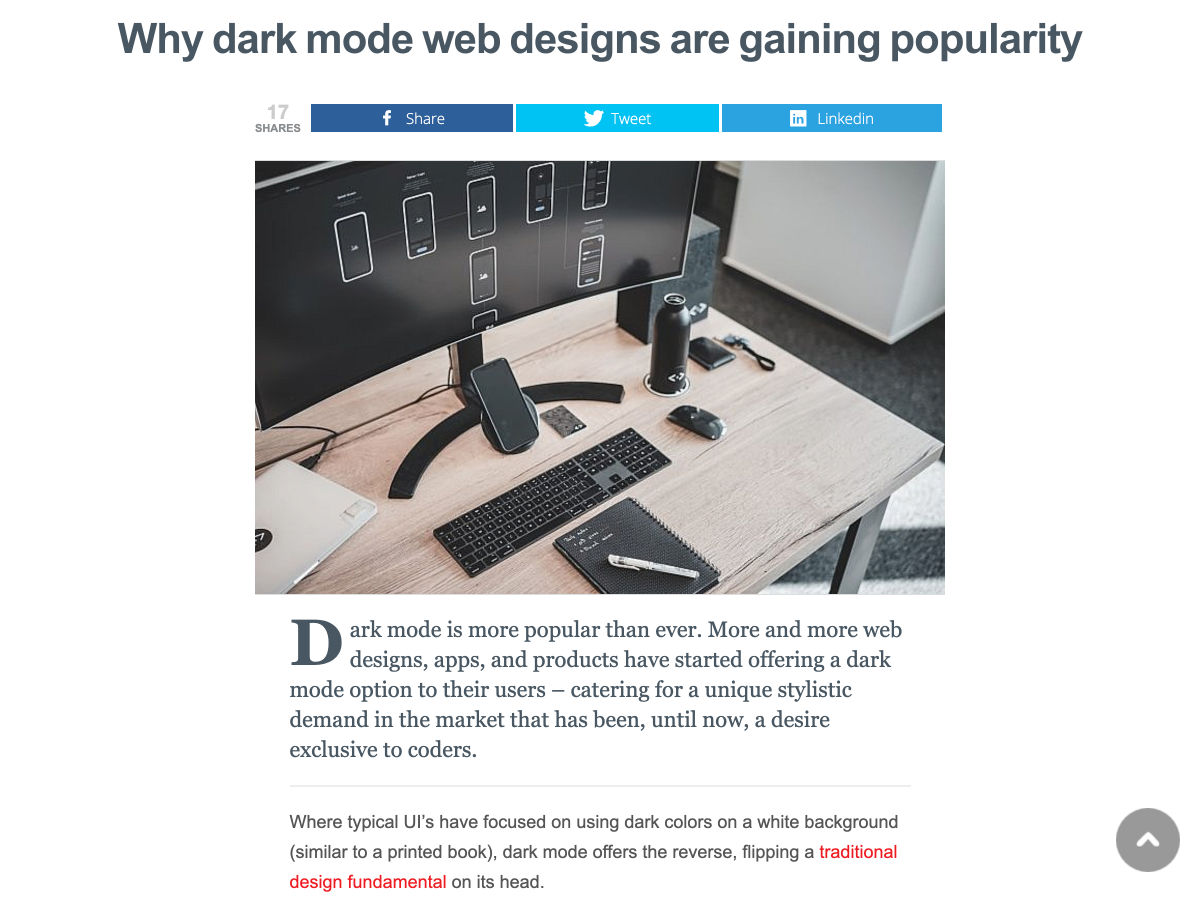
Why Dark Mode Web Designs are Gaining Popularity?

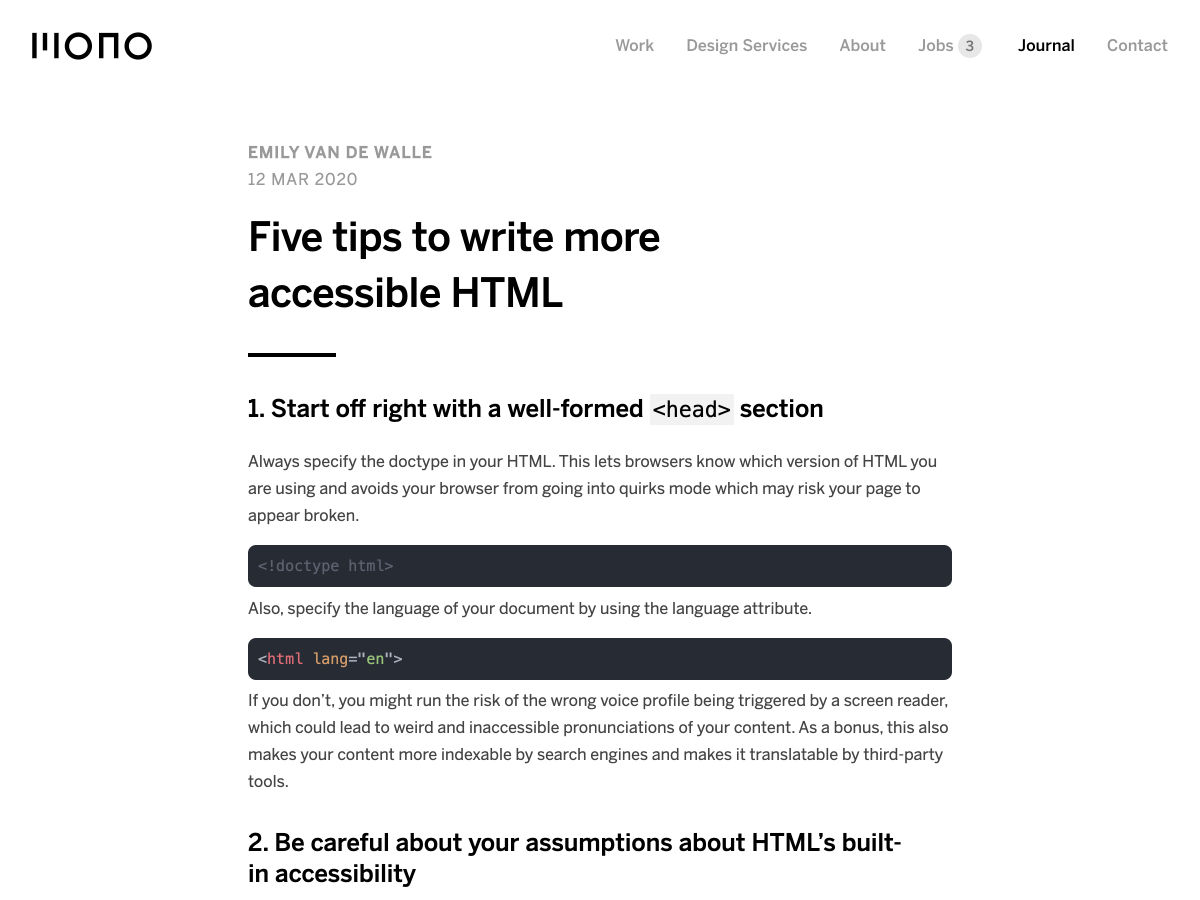
Five Tips to Write More Accessible HTML

14 Best Adobe Font Pairings for Websites

5 Principles of Visual Design in UX

How to Find your Most Creative Time of Day, and Make it Count

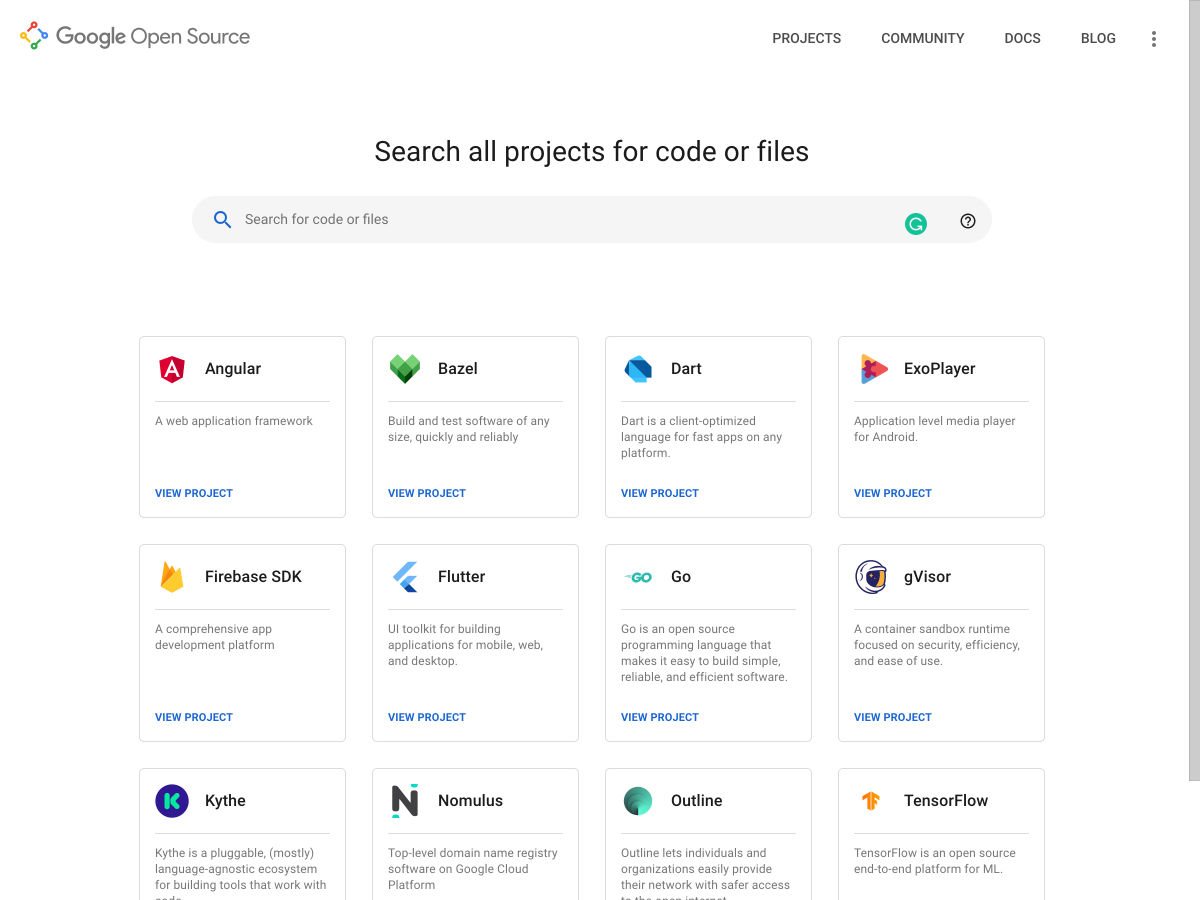
Google Open Source Code Search

7 Steps to Creating a Spectacular UX Case Study

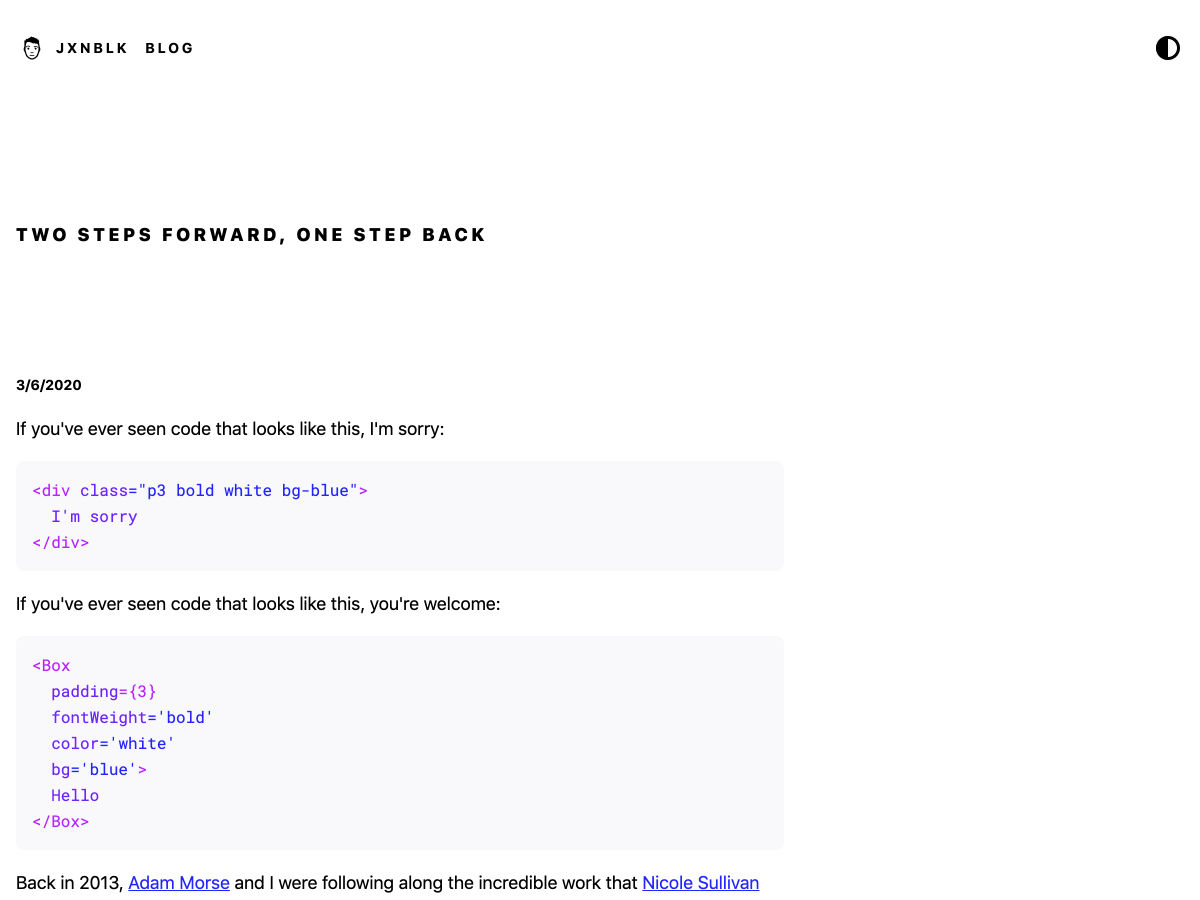
Two Steps Forward, One Step Back

Brand Discovery: 10 Key Questions to Ask Clients Before You Start Designing

15 Free High-Resolution Illustrator Brush Packs

Basics Behind Color Theory for Web Designers

Creative Packaging Designs

CSS Mondrian

The Psychology of Color and Emotional Design

Breaking Down Persuasive Design Principles

Want more? No problem! Keep track of top design news from around the web with Webdesigner News.

Source

Categories: Designing, Others Tags:

5 Free Prototyping Tools That You Won’t Want to Live Without

March 15th, 2020 No comments

A pictures is worth a thousand words, but if that’s true, then a single prototype is worth a thousand meetings.

We all know as designers how difficult it can sometimes be to communicate your ideas and visions clearly with a client.

When it comes to the custom design of a product, you have to try and try again to absolutely nail everything perfectly.

But even when the creation of a product is done… it never truly is, is it?

You always have room for a few modifications and improvements here and there.

And it’s better to find the little mistakes that were made on the product sooner rather than later, right?

And it’s an especially good thing to be able to run your designs by other colleagues, friends, fresh eyes, and ultimately, your client, in order to make sure you’ve done everything to the best of your ability.

The best way to do that is by using prototyping tools.

That’s why, today, we are going to go over 5 different prototyping tools.

Prototyping tools are especially helpful so that you can ensure that you are making your client happy by working alongside them, allowing them to see your process, and ultimately making sure that you keep your customer empathy intact while you’re going through the developmental phases.

And of course, we found the best free prototyping tools for you to use because we’ve always got your back when it comes to saving a buck.

So without further ado, let’s do this.

1. Adobe Experience Design

Alright, let’s just jump into this list and start it off with a banger. This is my personal favorite of the bunch of free prototyping tools, but maybe that’s because I’m a major Adobe fan-girl. And we can just let Adobe themselves sum up the tool in just a few words.

free protoype tool adobe xd

“Adobe XD is a powerful, collaborative, easy-to-use platform that helps you and your team create designs for websites, mobile apps, voice interfaces, games and more.”

You can work together with your team in real-time so that everyone is always on the same page and you can work faster and more efficiently.

“For designers, by designers.”

“We’re not just building a product — we’re building a community of designers striving for a better way to work.”

Price:

  • Free

Compatible with:

  • Windows
  • iOS
  • OS X
  • Android

Prototypes for:

  • All

Try it here: https://www.adobe.com/in/products/xd.html

2. Origami Studio

“Explore, iterate, and test your ideas. A new tool for designing modern interfaces, built and used by designers at Facebook. Get started today for free.”

origami studio free prototyping tool design

What may have started just for the design team at Facebook, has now been launched for all of us designers out there to use, for free.

“We created Origami to help us design and build many of our products like Facebook, Messenger and Instagram. We’re excited to see what you make in Origami.”

With Origami Studio, once you’ve created your mockup, you can view it in real-time on your phone to catch any bugs or errors, or just simply to enjoy the fruits of your labors.

Price:

  • Free

Compatible with:

  • OS X

Prototypes for:

  • iOS
  • Android

3. Invision

Design better. Faster. Together.

The digital product design platform powering the world’s best user experiences

By far the most popular prototyping tool in the entire world, I present to you, Invision.

Because they know how important it is to be able to create an amazing prototype, they constantly have their team testing and improving their product.

Because of this, they are continuously adding new, relevant features they will help you create the best prototype that you possibly could.

My favorite part of this prototyping tool is that you can set up planning columns like to-do lists, in progress, needs review, etc.

That way, everyone is on the same page and nothing gets lost in planning.

The tool is free at first, and if you get hooked, in my opinion, the price of it is quite affordable thereafter.

Price:

  • The first project is free
  • 3 projects (which is the starter package) – $15/month
  • Unlimited Projects (which is the professional package) – $25/month

Runs on:

  • Web

Prototypes for:

  • Web
  • iOS
  • Android

4. Atomic

Atomic makes it easy to create and deliver functionality to your users on any device or platform.

If you’re a major Google Chrome fan, then this tool might just be for you.

In order to use Atomic, because it is a web-based tool, you have to use Google Chrome.

Because it is a web-based tool, other designers and developers do not need to install any app, but instead, simply use the Chrome browser in order to see the prototype.

One thing that really does comes in handy is the play button. By clicking on it, you get to see all of your changes and animations in action and progression.

It’s pretty satisfying, but you can also see if there’s anything that went wrong that you’d like to change.

Cost:

  • 1 prototype (30-day trial) – Free
  • Unlimited prototypes for 1 user – $19
  • Unlimited prototypes for up to 10 users – $99

Runs on:

  • Web

Prototypes for:

  • All

5. Sketch

The best products start with Sketch

Create, prototype, collaborate and turn your ideas into incredible products with the definitive platform for digital design.

And last but not least, I present you with Sketch.

If you love photoshop, then you’re in luck.

Sketch is very similar to photoshop in many different ways, but it is most similar in the fact that you can manipulate and edit photos any way that you want.

Because Sketch’s workflow is completely vector-based, it makes it easy to create amazing prototypes.

Another nice thing about Sketch is that you can easily copy and paste things that are constantly repeating themselves in UI, such as buttons, menus, bars… You name it. It’ll save you lots of time and headache in the end.

Cost:

  • Trial – Free
  • Full version – One-time $99 payment

Compatible with:

  • OS X

Prototypes for:

  • Web
  • iOS
  • OS X

Wrapping up…

We hope you found this article helpful and the perfect prototype tool for you.

If we missed any free prototyping tools that you use on a daily basis, let us know in the comments below which ones are your favorite and we’ll cover them in another article.

Until next time,

Stay creative, folks!

Read More at 5 Free Prototyping Tools That You Won’t Want to Live Without

Categories: Designing, Others Tags:

The CSS Podcast

March 15th, 2020 No comments

From Adam and Una at Google, a podcast just about CSS. I believe I’m contractually obliged to link to that! Just one episode out so far, a shorty about the box model.

Last time I wrote up podcasts I like was 8 years ago most of them are dead now, except the biggies like This American Life and the like. ShopTalk Show and CodePen Radio are still going strong! These days I use Pocket Casts as a player and I like industry shows like:

Here’s a screenshot of all the ones I subscribe to, but I find I only have time to listen to maybe 10% of that if I’m lucky.

I do a lot of listening to things friends say are good, whether I subscribe or not.

Direct Link to ArticlePermalink

The post The CSS Podcast appeared first on CSS-Tricks.
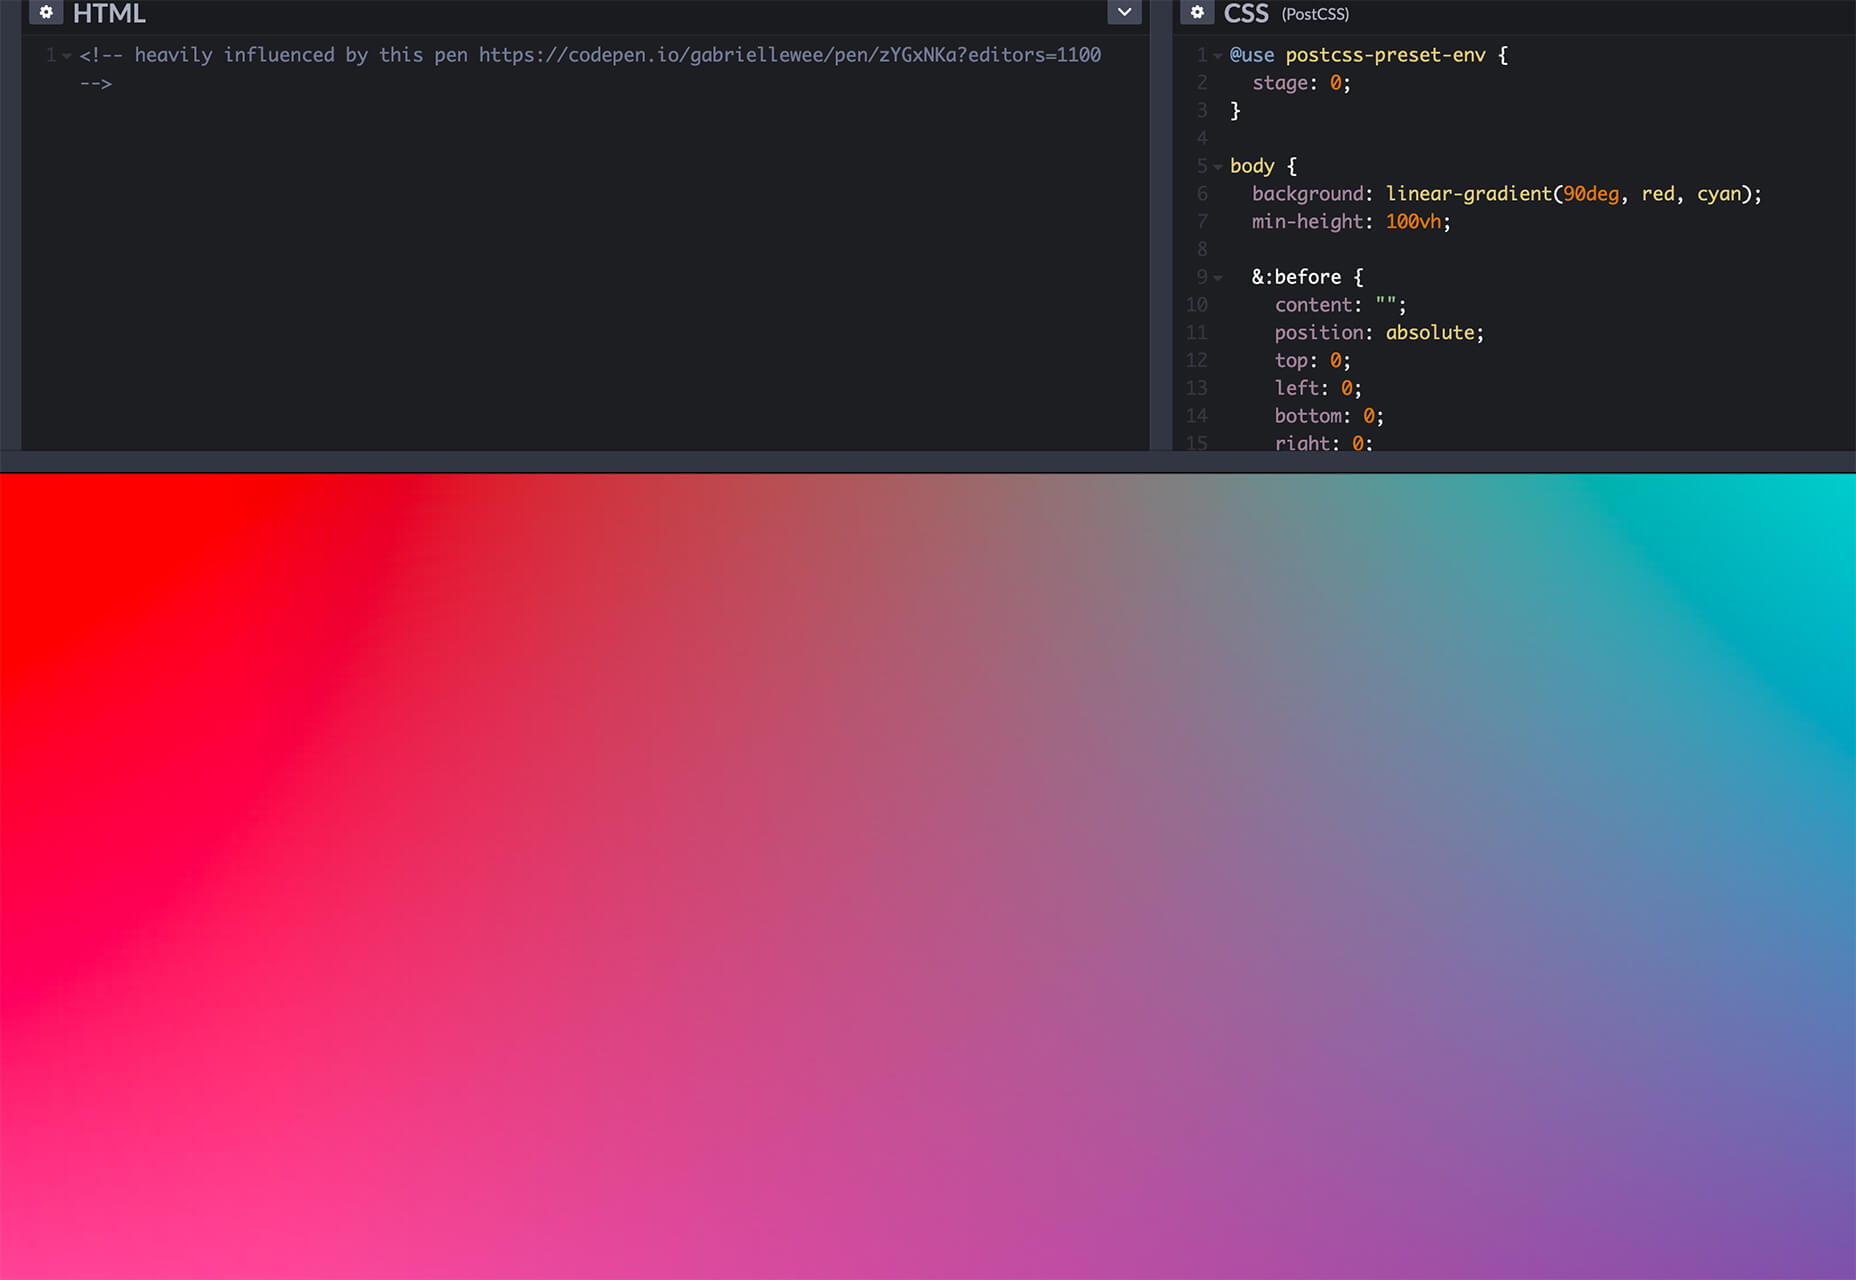
Categories: Designing, Others Tags:

“weeds of specificity”

March 13th, 2020 No comments

Lara Schenck:

[…] with WordPress child themes, you are all but guaranteed to get into the weeds of specificity, hunting around theme stylesheets that you didn’t author, trying to figure out what existing declaration is preventing you from applying a new style, and then figuring out the least specificity you need to override it, and then thinking “Maybe it would be faster if I just wrote all of this myself”.

Her point wasn’t child themes (although I think that’s a perfect thing to point to as the way you work with them is all with overriding what is already there), but the expectation of knowledge:

[…] unless you are “a CSS person” this understanding of specificity and its impact on the future of the code-base is somewhat specialized knowledge. Should everyone who writes CSS be expected to understand these details? Maybe, but the more experienced I become in all kinds of development, I’m starting to think that’s an unrealistic expectation given how much other stuff we have to know as developers.

Direct Link to ArticlePermalink

The post “weeds of specificity” appeared first on CSS-Tricks.
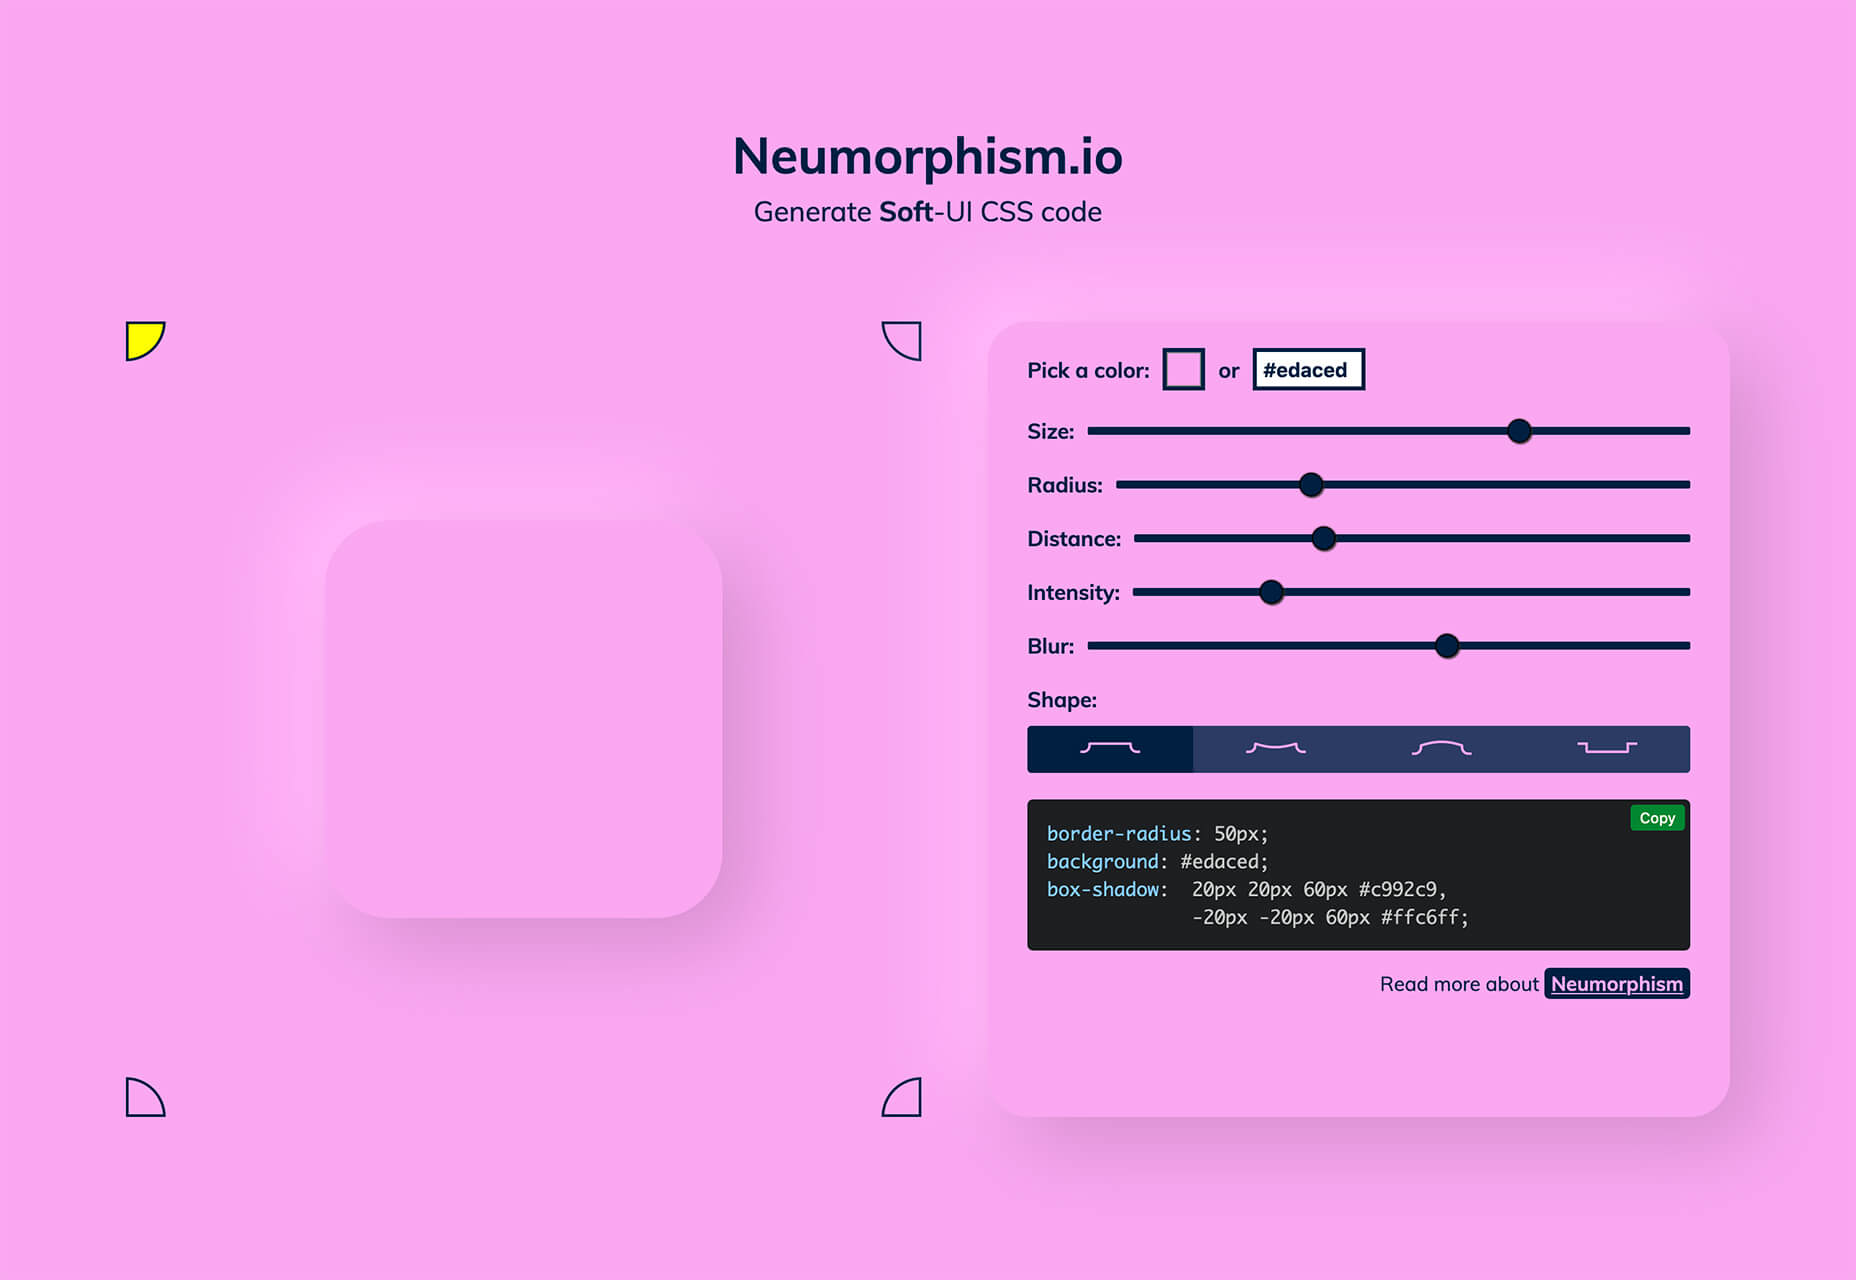
Categories: Designing, Others Tags:

Get Started Building GraphQL APIs With Node

March 13th, 2020 No comments

We all have a number of interests and passions. For example, I’m interested in JavaScript, 90’s indie rock and hip hop, obscure jazz, the city of Pittsburgh, pizza, coffee, and movies starring John Lurie. We also have family members, friends, acquaintances, classmates, and colleagues who also have their own social relationships, interests, and passions. Some of these relationships and interests overlap, like my friend Riley who shares my interest in 90’s hip hop and pizza. Others do not, like my colleague Harrison, who prefers Python to JavaScript, only drinks tea, and prefers current pop music. All together, we each have a connected graph of the people in our lives, and the ways that our relationships and interests overlap.

These types of interconnected data are exactly the challenge that GraphQL initially set out to solve in API development. By writing a GraphQL API we are able to efficiently connect data, which reduces the complexity and number of requests, while allowing us to serve the client precisely the data that it needs. (If you’re into more GraphQL metaphors, check out Meeting GraphQL at a Cocktail Mixer.)

In this article, we’ll build a GraphQL API in Node.js, using the Apollo Server package. To do so, we’ll explore fundamental GraphQL topics, write a GraphQL schema, develop code to resolve our schema functions, and access our API using the GraphQL Playground user interface.

What is GraphQL?

GraphQL is an open source query and data manipulation language for APIs. It was developed with the goal of providing single endpoints for data, allowing applications to request exactly the data that is needed. This has the benefit of not only simplifying our UI code, but also improving performance by limiting the amount of data that needs to be sent over the wire.

What we’re building

To follow along with this tutorial, you’ll need Node v8.x or later and some familiarity with working with the command line.

We’re going to build an API application for book highlights, allowing us to store memorable passages from the things that we read. Users of the API will be able to perform “CRUD” (create, read, update, delete) operations against their highlights:

  • Create a new highlight
  • Read an individual highlight as well as a list of highlights
  • Update a highlight’s content
  • Delete a highlight

Getting started

To get started, first create a new directory for our project, initialize a new node project, and install the dependencies that we’ll need:

# make the new directory
mkdir highlights-api
# change into the directory
cd highlights-api
# initiate a new node project
npm init -y
# install the project dependencies
npm install apollo-server graphql
# install the development dependencies
npm install nodemon --save-dev

Before moving on, let’s break down our dependencies:

  • apollo-server is a library that enables us to work with GraphQL within our Node application. We’ll be using it as a standalone library, but the team at Apollo has also created middleware for working with existing Node web applications in Express, hapi, Fastify, and Koa.
  • graphql includes the GraphQL language and is a required peer dependency of apollo-server.
  • nodemon is a helpful library that will watch our project for changes and automatically restart our server.

With our packages installed, let’s next create our application’s root file, named index.js. For now, we’ll console.log() a message in this file:

console.log("📚 Hello Highlights");

To make our development process simpler, we’ll update the scripts object within our package.json file to make use of the nodemon package:

"scripts": {
  "start": "nodemon index.js"
},

Now, we can start our application by typing npm start in the terminal application. If everything is working properly, you will see ? Hello Highlights logged to your terminal.

GraphQL schema types

A schema is a written representation of our data and interactions. By requiring a schema, GraphQL enforces a strict plan for our API. This is because the API can only return data and perform interactions that are defined within the schema. The fundamental component of GraphQL schemas are object types. GraphQL contains five built-in types:

  • String: A string with UTF-8 character encoding
  • Boolean: A true or false value
  • Int: A 32-bit integer
  • Float: A floating-point value
  • ID: A unique identifier

We can construct a schema for an API with these basic components. In a file named schema.js, we can import the gql library and prepare the file for our schema syntax:

const { gql } = require('apollo-server');

const typeDefs = gql`
  # The schema will go here
`;

module.exports = typeDefs;

To write our schema, we first define the type. Let’s consider how we might define a schema for our highlights application. To begin, we would create a new type with a name of Highlight:

const typeDefs = gql`
  type Highlight {
  }
`;

Each highlight will have a unique ID, some content, a title, and an author. The Highlight schema will look something like this:

const typeDefs = gql`
  type Highlight {
    id: ID
    content: String
    title: String
    author: String
  }
`;

We can make some of these fields required by adding an exclamation point:

const typeDefs = gql`
  type Highlight {
    id: ID!
    content: String!
    title: String
    author: String
  }
`;

Though we’ve defined an object type for our highlights, we also need to provide a description of how a client will fetch that data. This is called a query. We’ll dive more into queries shortly, but for now let’s describe in our schema the ways in which someone will retrieve highlights. When requesting all of our highlights, the data will be returned as an array (represented as [Highlight]) and when we want to retrieve a single highlight we will need to pass an ID as a parameter.

const typeDefs = gql`
  type Highlight {
    id: ID!
    content: String!
    title: String
    author: String
  }
  type Query {
    highlights: [Highlight]!
    highlight(id: ID!): Highlight
  }
`;

Now, in the index.js file, we can import our type definitions and set up Apollo Server:

const {ApolloServer } = require('apollo-server');
const typeDefs = require('./schema');

const server = new ApolloServer({ typeDefs });

server.listen().then(({ url }) => {
  console.log(`📚 Highlights server ready at ${url}`);
});

If we’ve kept the node process running, the application will have automatically updated and relaunched, but if not, typing npm start from the project’s directory in the terminal window will start the server. If we look at the terminal, we should see that nodemon is watching our files and the server is running on a local port:

[nodemon] 2.0.2
[nodemon] to restart at any time, enter `rs`
[nodemon] watching dir(s): *.*
[nodemon] watching extensions: js,mjs,json
[nodemon] starting `node index.js`
📚 Highlights server ready at http://localhost:4000/

Visiting the URL in the browser will launch the GraphQL Playground application, which provides a user interface for interacting with our API.

GraphQL Resolvers

Though we’ve developed our project with an initial schema and Apollo Server setup, we can’t yet interact with our API. To do so, we’ll introduce resolvers. Resolvers perform exactly the action their name implies; they resolve the data that the API user has requested. We will write these resolvers by first defining them in our schema and then implementing the logic within our JavaScript code. Our API will contain two types of resolvers: queries and mutations.

Let’s first add some data to interact with. In an application, this would typically be data that we’re retrieving and writing to from a database, but for our example let’s use an array of objects. In the index.js file add the following:

let highlights = [
  {
    id: '1',
    content: 'One day I will find the right words, and they will be simple.',
    title: 'Dharma Bums',
    author: 'Jack Kerouac'
  },
  {
    id: '2',
    content: 'In the limits of a situation there is humor, there is grace, and everything else.',
    title: 'Arbitrary Stupid Goal',
    author: 'Tamara Shopsin'
  }
]

Queries

A query requests specific data from an API, in its desired format. The query will then return an object, containing the data that the API user has requested. A query never modifies the data; it only accesses it. We’ve already written a two queries in our schema. The first returns an array of highlights and the second returns a specific highlight. The next step is to write the resolvers that will return the data.

In the index.js file, we can add a resolvers object, which can contain our queries:

const resolvers = {
  Query: {
    highlights: () => highlights,
    highlight: (parent, args) => {
      return highlights.find(highlight => highlight.id === args.id);
    }
  }
};

The highlights query returns the full array of highlights data. The highlight query accepts two parameters: parent and args. The parent is the first parameter of any GraqhQL query in Apollo Server and provides a way of accessing the context of the query. The args parameter allows us to access the user provided arguments. In this case, users of the API will be supplying an id argument to access a specific highlight.

We can then update our Apollo Server configuration to include the resolvers:

const server = new ApolloServer({ typeDefs, resolvers });

With our query resolvers written and Apollo Server updated, we can now query API using the GraphQL Playground. To access the GraphQL Playground, visit http://localhost:4000 in your web browser.

A query is formatted as so:

query {
  queryName {
      field
      field
    }
}

With this in mind, we can write a query that requests the ID, content, title, and author for each our highlights:

query {
  highlights {
    id
    content
    title
    author
  }
}

Let’s say that we had a page in our UI that lists only the titles and authors of our highlighted texts. We wouldn’t need to retrieve the content for each of those highlights. Instead, we could write a query that only requests the data that we need:

query {
  highlights {
    title
    author
  }
}

We’ve also written a resolver to query for an individual note by including an ID parameter with our query. We can do so as follows:

query {
  highlight(id: "1") {
    content
  }
}

Mutations

We use a mutation when we want to modify the data in our API. In our highlight example, we will want to write a mutation to create a new highlight, one to update an existing highlight, and a third to delete a highlight. Similar to a query, a mutation is also expected to return a result in the form of an object, typically the end result of the performed action.

The first step to updating anything in GraphQL is to write the schema. We can include mutations in our schema, by adding a mutation type to our schema.js file:

type Mutation {
  newHighlight (content: String! title: String author: String): Highlight!
  updateHighlight(id: ID! content: String!): Highlight!
  deleteHighlight(id: ID!): Highlight!
}

Our newHighlight mutation will take the required value of content along with optional title and author values and return a Highlight. The updateHighlight mutation will require that a highlight id and content be passed as argument values and will return the updated Highlight. Finally, the deleteHighlight mutation will accept an ID argument, and will return the deleted Highlight.

With the schema updated to include mutations, we can now update the resolvers in our index.js file to perform these actions. Each mutation will update our highlights array of data.

const resolvers = {
  Query: {
    highlights: () => highlights,
    highlight: (parent, args) => {
      return highlights.find(highlight => highlight.id === args.id);
    }
  },
  Mutation: {
    newHighlight: (parent, args) => {
      const highlight = {
        id: String(highlights.length + 1),
        title: args.title || '',
        author: args.author || '',
        content: args.content
      };
      highlights.push(highlight);
      return highlight;
    },
    updateHighlight: (parent, args) => {
      const index = highlights.findIndex(highlight => highlight.id === args.id);
      const highlight = {
        id: args.id,
        content: args.content,
        author: highlights[index].author,
        title: highlights[index].title
      };
      highlights[index] = highlight;
      return highlight;
    },
    deleteHighlight: (parent, args) => {
      const deletedHighlight = highlights.find(
        highlight => highlight.id === args.id
      );
      highlights = highlights.filter(highlight => highlight.id !== args.id);
      return deletedHighlight;
    }
  }
};

With these mutations written, we can use the GraphQL Playground to practice mutating the data. The structure of a mutation is nearly identical to that of a query, specifying the name of the mutation, passing the argument values, and requesting specific data in return. Let’s start by adding a new highlight:

mutation {
  newHighlight(author: "Adam Scott" title: "JS Everywhere" content: "GraphQL is awesome") {
    id
    author
    title
    content
  }
}

We can then write mutations to update a highlight:

mutation {
  updateHighlight(id: "3" content: "GraphQL is rad") {
    id
    content
  }
}

And to delete a highlight:

mutation {
  deleteHighlight(id: "3") {
    id
  }
}

Wrapping up

Congratulations! You’ve now successfully built a GraphQL API, using Apollo Server, and can run GraphQL queries and mutations against an in-memory data object. We’ve established a solid foundation for exploring the world of GraphQL API development.

Here are some potential next steps to level up:

The post Get Started Building GraphQL APIs With Node appeared first on CSS-Tricks.

Categories: Designing, Others Tags: