Archive

Archive for the ‘’ Category

AI in Cybersecurity: Facing the Challenges in 2024

March 4th, 2024 No comments

In today’s digital age, cybersecurity has become a paramount concern for individuals and organizations alike. The evolving landscape, characterized by increasingly sophisticated cyberattacks, necessitates advanced solutions to protect sensitive data and critical systems. Artificial Intelligence (AI) has emerged as a game-changer in the realm of cybersecurity, offering powerful tools and techniques to bolster our defenses and stay one step ahead of cybercriminals. In this article, we will explore the role of AI in cybersecurity, its key applications, and its potential to reshape the future of digital protection.

The Growing Cybersecurity Challenge

Cybersecurity threats have evolved from simple viruses and malware to complex, multi-faceted attacks that exploit network, software, and human behavior vulnerabilities. Hackers are now armed with advanced tools and techniques, such as ransomware, zero-day exploits, and social engineering tactics, making it increasingly difficult to detect and stop their activities.

Traditional cybersecurity measures, while still essential, are often reactive in nature, relying on signature-based approaches and rule-based systems to identify known threats. This approach leaves organizations vulnerable to new, unknown threats and zero-day vulnerabilities. This is where AI steps in as a proactive and dynamic solution.

Talk more about popular cyber threats, and the impact they have on businesses. What is the current situation? Are there any cases we can share about big cyber-attacks, how much did they cost? 

Artificial Intelligence (AI) for Cybersecurity

Cybersecurity is the practice of protecting systems, networks, and data from unauthorized access, use, disclosure, disruption, modification, or destruction. AI is a rapidly evolving technology that has the potential to revolutionize cybersecurity.

AI can be used to automate many of the tasks involved in cybersecurity, such as threat detection, vulnerability assessment, and incident response. It can also be used to develop new security solutions that are more effective than traditional methods.

Here are some of the ways that AI is being used in cybersecurity today:

  • Threat detection: Analyze large amounts of data to identify potential threats. This can be done by using machine learning algorithms to learn patterns of malicious activity.
  • Vulnerability assessment: Scan systems and networks for vulnerabilities which helps organizations identify and fix security weaknesses before they are exploited by attackers.
  • Incident response: Automate the response to security incidents. This can help companies to quickly identify and contain threats, minimizing the damage.
  • User behavior analytics: Analyze user behavior to identify potential threats. This can be achieved by looking for patterns of unusual activity, such as logins from unauthorized locations or attempts to access sensitive data.
  • Risk management: Assess the risk of cyber-attacks, helping organizations to prioritize their security efforts and allocate resources more effectively.

AI is still a developing technology, but it has the potential to make a significant impact on cybersecurity. As AI continues to evolve, it is likely to play an increasingly important role in protecting our digital world.

AI-Powered Threat Detection

One of the most critical applications of AI in cybersecurity is threat detection. AI-driven systems can analyze vast amounts of data in real time, identifying anomalous patterns and potential threats that may go unnoticed by human operators. Machine learning algorithms can recognize subtle deviations from normal behavior, enabling the early detection of malicious activities.

AI can also enhance malware detection by using behavioral analysis to identify suspicious code execution and network behavior, even when dealing with previously unseen malware strains. This proactive approach to threat detection is a significant advantage in the battle against cybercriminals.

Behavioral Analysis and User Anomaly Detection

Human error remains a significant weak point in cybersecurity. Employees inadvertently clicking on phishing emails or falling victim to social engineering attacks can lead to data breaches. AI can mitigate this risk through user anomaly detection.

AI systems can establish a baseline of normal user behavior for everyone within an organization. When deviations from this baseline occur, such as unusual login times or access requests, AI algorithms can trigger alerts, potentially preventing insider threats and unauthorized access.

In my work, I’ve come across a very good case for showing how powerful such tools can be.
In a manufacturing process where rare earth materials were processed, the outputs produced were not consistent, so managers decided to apply data mining techniques to the data. Results were shocking: for specific shifts with specific people, machines were being stopped for “urgent maintenance because of malfunctions”.  Further analysis showed that the output materials were consistently less than other shifts (2 grams less power material), accounting for the downtime. An internal investigation, backed by data analysis, revealed that there was an organized group of employees stopping machines and stealing from the products, with a sophisticated clandestine export process.

Automated Incident Response

The speed at which cyberattacks unfold necessitates equally rapid responses. AI can assist in automating incident response, reducing the time it takes to identify and mitigate threats. Automated responses can include isolating compromised systems, blocking malicious IP addresses, and even initiating patch management procedures.

By combining AI-driven threat detection with automated incident response, organizations can significantly reduce the impact of cyberattacks and minimize downtime.

Predictive Analysis and Threat Intelligence

AI systems excel at analyzing large datasets and identifying trends. In cybersecurity, this capability extends to predictive analysis and threat intelligence. AI can identify emerging threats by analyzing global cyberattack data, providing organizations with valuable insights into potential vulnerabilities.

Furthermore, AI can help organizations stay ahead of cybercriminals by predicting attack vectors and developing proactive defenses. This approach enables organizations to preemptively secure their systems against new and evolving threats.

The Future of AI in Cybersecurity

As cyber threats continue to evolve, the role of AI in cybersecurity will become increasingly vital. The integration of AI with other emerging technologies, such as the Internet of Things (IoT) and 5G, will pose new challenges and opportunities for safeguarding digital assets.

However, it is crucial to note that AI is not a panacea for cybersecurity. It is a tool that complements existing security measures and requires continuous monitoring and fine-tuning. Moreover, AI can be vulnerable to adversarial attacks, underscoring the need for ongoing research and development in the field.

Conclusion

AI is revolutionizing cybersecurity by providing advanced threat detection, proactive defense, and automated incident response capabilities. Its ability to analyze vast datasets and adapt to evolving threats makes it an indispensable tool in the fight against cybercriminals. As organizations increasingly embrace AI-driven cybersecurity solutions backed by custom software development partners, they will be better equipped to protect their data, systems, and reputation in our ever-connected digital world.

Featured image by Google DeepMind on Unsplash

The post AI in Cybersecurity: Facing the Challenges in 2024 appeared first on noupe.

Categories: Others Tags:

Exciting New Tools for Designers, March 2024

March 4th, 2024 No comments

The fast-paced world of design never stops turning, and staying ahead of the curve is essential for creatives. As technology advances, so do the tools available, offering new ways to bring your vision to life.

Categories: Designing, Others Tags:

Web Tech Trends to Watch in 2024 and Beyond

March 1st, 2024 No comments

It hardly seems possible given the radical transformations we’ve seen over the last few decades, but the web design landscape is evolving faster than ever.

Categories: Designing, Others Tags:

Modern CSS Tooltips And Speech Bubbles (Part 1)

March 1st, 2024 No comments

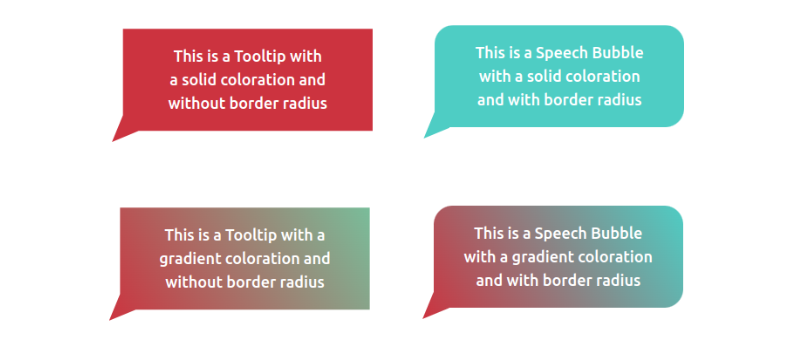
In a previous article, we explored ribbon shapes and different ways to approach them using clever combinations of CSS gradients and clip-path(). This time, I’d like to explore another shape, one that you’ve likely had to tackle at least once in your front-end life: tooltips. You know what we’re talking about, those little things that look like speech bubbles from comic books. They’re everywhere in the wild, from a hover effect for buttons to the text messaging app on your phone.

The shapes may look easy to make in CSS at first glance, but it always ends with a lot of struggles. For example, how do you adjust the position of the tail to indicate whether the tooltip is coming from a left, right, or center position? There are plenty of considerations to take into account when making tooltips — including overflowage, collision detection, and semantics — but it’s the shape and direction of the tail that I want to focus on because I often see inflexible fixed units used to position them.

Forget what you already know about tooltips because in this article, we will start from zero, and you will learn how to build a tooltip with minimal markup powered by modern CSS that provides flexibility to configure the component by adjusting CSS variables. We are not going to build one or two shapes, but… 100 different shapes!

That may sound like we’re getting into a super-long article, but actually, we can easily get there by adjusting a few values. In the end, you will have a back pocket full of CSS tricks that can be combined to create any shape you want.

And guess what? I’ve already created an online collection of 100 different tooltip shapes where you can easily copy and paste the code for your own use, but stay with me. You’re going to want to know the secret to unlocking hundreds of possibilities with the least possible code.

We’ll start with the shapes themselves, discussing how we can cut out the bubble and tail by combining CSS gradients and clipping. Then, we’ll pick things back up in a second article dedicated to improving another common approach to tooltips using borders and custom shapes.

The HTML

We’re only working with a single element:

<div class="tooltip">Your text content goes here</div>

That’s the challenge: Create hundreds of tooltip variations in CSS with only a single element to hook into in the HTML.

A Simple Tooltip Tail

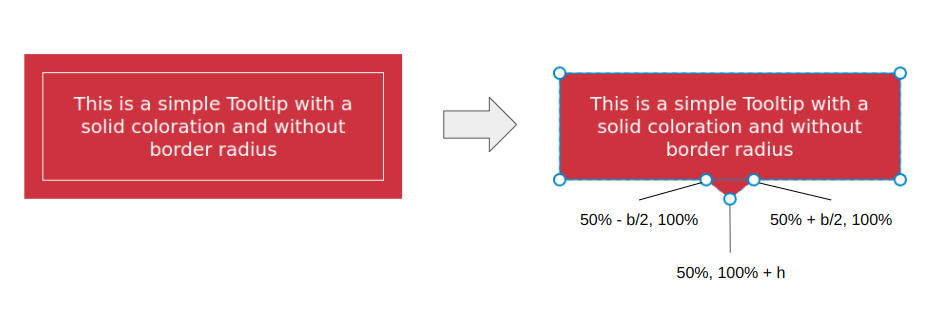
I’m going to skip right over the basic rectangular shape; you know how to set a width and height (or aspect-ratio) on elements. Let’s start with the simplest shape for the tooltip’s tail, one that can be accomplished with only two CSS properties:

.tooltip {
  /* tail dimension */
  --b: 2em; /* base */
  --h: 1em; /* height*/

  border-image: fill 0 // var(--h)
    conic-gradient(#CC333F 0 0); /* the color  */
  clip-path: 
    polygon(0 100%, 0 0, 100% 0, 100% 100%,
      calc(50% + var(--b) / 2) 100%,
      50% calc(100% + var(--h)),
      calc(50% - var(--b) / 2) 100%);
}

The border-image property creates an “overflowing color” while clip-path defines the shape of the tooltip with polygon() coordinates. (Speaking of border-image, I wrote a deep-dive on it and explain how it might be the only CSS property that supports double slashes in the syntax!)

The tooltip’s tail is placed at the bottom center, and we have two variables to control its dimensions:

We can do the exact same thing in more intuitive ways, like defining a background and then border (or padding) to create space for the tail:

background: #CC333F;
border-bottom: var(--h) solid #0000;

…or using box-shadow (or outline) for the outside color:

background: #CC333F;
box-shadow: 0 0 0 var(--h) #CC333F;

While these approaches are indeed easier, they require an extra declaration compared to the single border-image declaration we used. Plus, we’ll see later that border-image is really useful for accomplishing more complex shapes.

Here is a demo with the different directions so you can see how easy it is to adjust the above code to change the tail’s position.

We can fix this by setting limits to some values so the tail never falls outside the container. Two points of the polygon are concerned with the fix.

This:

calc(var(--p) + var(--b) / 2) 100%

…and this:

calc(var(--p) - var(--b) / 2) 100%

The first calc() needs to be clamped to 100% to avoid the overflow from the right side, and the second one needs to be clamped to 0% to avoid the overflow from the left side. We can use the min() and max() functions to establish the range limits:

clip-path: 
  polygon(0 100%, 0 0, 100% 0, 100% 100%,
    min(100%, var(--p) + var(--b) / 2) 100%,
    var(--p) calc(100% + var(--h)),
    max(0%, var(--p) - var(--b) / 2) 100%);

Adjusting The Tail Shape

Let’s integrate another variable, --x, into the clip-path() and use it to adjust the shape of the tail:

.tooltip {
  /* tail dimension */
  --b: 2em; /* base */
  --h: 1em; /* height*/

  --p: 50%;  /* tail position */
  --x: -2em; /* tail shape */

  border-image: fill 0 // 9999px
    conic-gradient(#CC333F 0 0); /* the color  */
  clip-path: 
    polygon(0 100%, 0 0, 100% 0, 100% 100%,
      min(100%, var(--p) + var(--b) / 2) 100%,
      calc(var(--p) + var(--x)) calc(100% + var(--h)),
      max(0%, var(--p) - var(--b) / 2) 100%);
}

The --x variable can be either positive or negative (using whatever unit you want, including percentages). What we’re doing is adding the variable that establishes the tail’s shape, --x, to the tail’s position, --p. In other words, we’ve updated this:

var(--p) calc(100% + var(--h))

…to this:

calc(var(--p) + var(--x)) calc(100% + var(--h))

And here is the outcome:

The tooltip’s tail points in either the right or left direction, depending on whether --x is a positive or negative value. Go ahead and use the range sliders in the following demo to see how the tooltip’s tail is re-positioned (--p) and re-shaped (--x) when adjusting two variables.

Note that I have updated the border-image outset to an impractically large value (9999px) instead of using the --h variable. The shape of the tail can be any type of triangle and can take a bigger area. Since there’s no way for us to know the exact value of the outset, we use that big value to make sure we have enough room to fill the tail in with color, no matter its shape.

Does the outset concept look strange to you? I know that working with border-image isn’t something many of us do all that often, so if this approach is tough to wrap your head around, definitely go check out my border-image article for a thorough demonstration of how it works.

Working With Gradients

Most of the trouble starts when we want to color the tooltip with a gradient instead of a flat color. Applying one color is simple — even with older techniques — but when it comes to gradients, it’s not easy to make the tail color flow smoothly into the container’s color.

But guess what? That’s no problem for us because we are already using a gradient in our border-image declaration!

border-image: fill 0 // var(--h)
  conic-gradient(#CC333F 0 0);

border-image only accepts gradients or images, so to produce a solid color, I had to use a gradient consisting of just one color. But if you change it into a “real” gradient that transitions between two or more colors, then you get your tooltip gradient. That’s all!

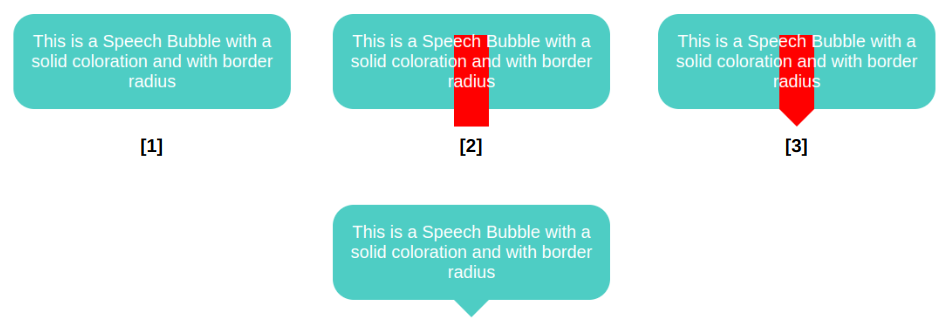
We start by declaring a background and border-radius on the .tooltip. Nothing fancy. Then, we move to the border-image property so that we can add a bar (highlighted in red in the last figure) that slightly overflows the container from the bottom. This part is a bit tricky, and here I invite you to read my previous article about border-image to understand this bit of CSS magic. From there, we add the clip-path and get our final shape.

.tooltip {
  /* triangle dimension */
  --b: 2em; /* base */
  --h: 1em; /* height */

  --p: 50%; /* position  */
  --r: 1.2em; /* the radius */
  --c: #4ECDC4;

  border-radius: var(--r);
  clip-path: polygon(0 100%, 0 0, 100% 0, 100% 100%,
    min(100%, var(--p) + var(--b) / 2) 100%,
    var(--p) calc(100% + var(--h)),
    max(0%, var(--p) - var(--b) / 2) 100%);
  background: var(--c);
  border-image: conic-gradient(var(--c) 0 0) fill 0/
    var(--r) calc(100% - var(--p) - var(--b) / 2) 0 calc(var(--p) - var(--b) / 2)/
    0 0 var(--h) 0;
}

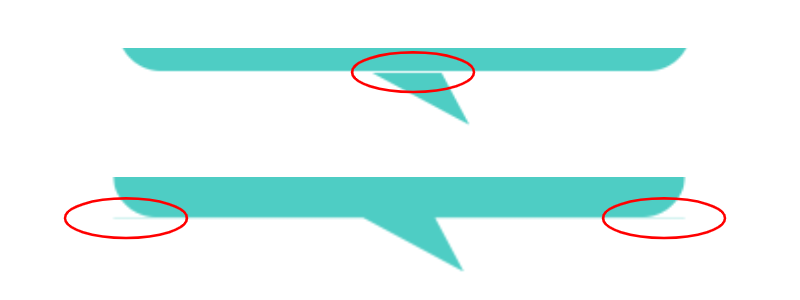
This visual glitch happens when the border-image overlaps with the rounded corners. To fix this, we need to adjust the border-radius value based on the tail’s position (--p).

We are not going to update all the radii, only the bottom ones and, more precisely, the horizontal values. I want to remind you that border-radius accepts up to eight values — each corner takes two values that set the horizontal and vertical directions — and in our case, we will update the horizontal value of the bottom-left and bottom-right corners:

border-radius:
  /* horizontal values */
  var(--r) 
  var(--r) 
  min(var(--r),100% - var(--p) - var(--b)/2) /* horizontal bottom-right */
  min(var(--r),var(--p) - var(--b)/2) /* horizontal bottom-left */
  /
  /* vertical values */
  var(--r)
  var(--r)
  var(--r)
  var(--r)

All the corner values are equal to --r, except for the bottom-left and bottom-right corners. Notice the forward slash (/), as it is part of the syntax that separates the horizontal and vertical radii values.

Now, let’s dig in and understand what is happening here. For the bottom-left corner, when the position of the tail is on the right, the position (--p) variable value will be big in order to keep the radius equal to the radius (--r), which serves as the minimum value. But when the position gets closer to the left, the value of --p decreases and, at some point, becomes smaller than the value of --r. The result is the value of the radius slowly decreasing until it reaches 0. It adjusts as the position updates!

I know that’s a lot to process, and a visual aid usually helps. Try slowly updating the tail’s position in the following demo to get a clearer picture of what’s happening.

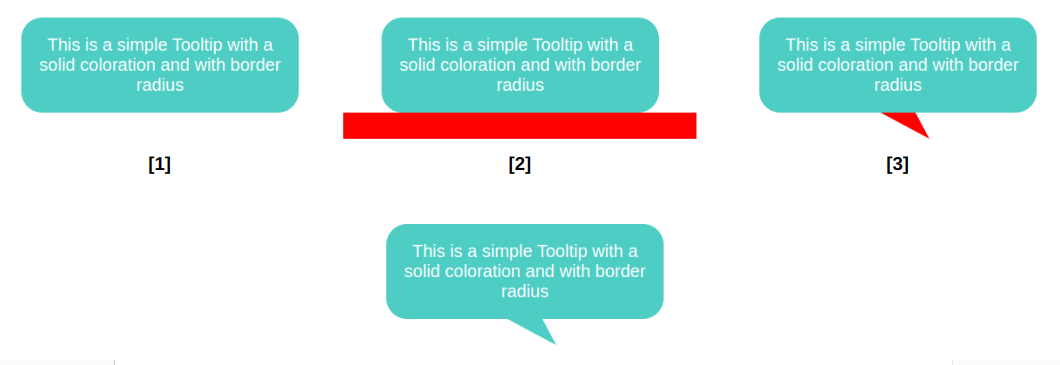
This time, the border image creates a horizontal bar along the bottom that is positioned directly under the element and extends outside of its boundary so that we have enough color for the tail when it’s closer to the edge.

.tooltip {
  /* tail dimension */
  --b: 2em; /* base */
  --h: 1.5em; /* height */

  --p: 50%; /* position */
  --x: 1.8em; /* tail position */
  --r: 1.2em; /* the radius */
  --c: #4ECDC4;

  border-radius: var(--r) var(--r) min(var(--r), 100% - var(--p) - var(--b) / 2) min(var(--r), var(--p) - var(--b) / 2) / var(--r);
  clip-path: polygon(0 100%, 0 0, 100% 0, 100% 100%,
    min(100%, var(--p) + var(--b) / 2) 100%,
    calc(var(--p) + var(--x)) calc(100% + var(--h)),
    max(0%, var(--p) - var(--b) / 2) 100%);
  background: var(--c);
  border-image: conic-gradient(var(--c) 0 0) 0 0 1 0 / 0 0 var(--h) 0 / 0 999px var(--h) 999px;
}

That’s why I do not use this approach when working with a simple isosceles triangle. This said, the method is perfectly fine, and in most cases, you may not see any visual glitches.

Putting Everything Together

We’ve looked at tooltips with tails that have equal sides, ones with tails that change shape, ones where the tail changes position and direction, ones with rounded corners, and ones that are filled in with gradients. What would it look like if we combined all of these examples into one mega-demo?

We can do it, but not by combining the approaches we’ve covered. We need another method, this time using a pseudo-element. No border-image for this one, I promise!

.tooltip {
  /* triangle dimension */
  --b: 2em; /* base */
  --h: 1em; /* height */

  --p: 50%; /* position */
  --r: 1.2em; /* the radius */

  border-radius: var(--r) var(--r) min(var(--r), 100% - var(--p) - var(--b) / 2) min(var(--r), var(--p) - var(--b) / 2) / var(--r);
  background: 0 0 / 100% calc(100% + var(--h)) 
    linear-gradient(60deg, #CC333F, #4ECDC4); /* the gradient */
  position: relative;
  z-index: 0;
}
.tooltip:before {
  content: "";
  position: absolute;
  z-index: -1;
  inset: 0 0 calc(-1*var(--h));
  background-image: inherit;
  clip-path: 
    polygon(50% 50%,
      min(100%, var(--p) + var(--b) / 2) calc(100% - var(--h)),
      var(--p) 100%,
      max(0%, var(--p) - var(--b) / 2) calc(100% - var(--h)));
}

The pseudo-element is used to create the tail at the bottom and notice how it inherits the gradient from the main element to simulate a continuous gradient that covers the entire shape.

Another important thing to note is the background-size declared in the .tooltip. The pseudo-element is covering a bigger area due to the negative bottom value, so we have to increase the height of the gradient so it covers the same area.

Can you figure it out? The code for all of them is included in my tooltip collection if you need a reference, but do try to make them yourself — it’s good exercise! Maybe you will find a different (or perhaps better) approach than mine.

Categories: Others Tags:

Key Features You Must Have in Your E-commerce Product Pages

February 29th, 2024 No comments

Introduction

What are ecommerce product pages?

E-commerce product pages refer to the specific pages on online retail sites that provide detailed information on a particular product available for purchase. They allow potential customers to view images, descriptions, pricing, and more.

Why are product pages crucial for conversions?

Product pages have an outsized influence on e-commerce conversion rates and revenue. They often account for 50% or more of all sales. Optimized product detail pages keep visitors engaged to drive add-to-cart rates. Elements like compelling descriptions, reviews, images and clear pricing all impact how likely visitors will complete transactions. Product pages have the highest conversion value across most retail sites.

Essential Product Page Features For Your eCommerce Business

1. Compelling Product Images

High-quality visuals: Showcasing products through compelling, high-resolution images is one of the most vital elements for conversion-focused product pages. Crisp, detailed product shots allow potential customers to inspect items closely and make informed purchase decisions. Optimized images drive higher click-through rates.

Multiple angles and views: Rather than rely on a single product image, detail pages should present the item from multiple angles and perspectives. Different views, displayed through image sliders and galleries, reveal more details to aid the purchase process.

Zoom functionality: Pairing images with zoom and expand capabilities enables visitors to essentially examine products as if physically holding them. This insight builds trust and confidence to add items to the cart.

Lifestyle images: Supplement the core product visuals with lifestyle images depicting the item in context. This triggers how customers may imagine actually using or wearing the product once purchased. Connecting with customer lifestyles boosts conversion potential.

360° product views: Advanced imagery like 360-degree spins allows scrutinizing a product from every angle. Interactive elements like click and drag also help potential buyers visualize the product in use. This reduces doubts by revealing everything about an item digitally.

Image optimization for SEO: Behind the scenes, product images should be fully optimized to also assist with search visibility. Descriptive file names, alt text and compressed file sizes allow images to improve how pages perform in search queries.

2. Product Descriptions that Sell

Clear and concise language: Produce descriptions with clear, concise and consistent messaging that allow visitors to quickly comprehend what a product is and does. Use simple, factual language around features and functionality while avoiding over-embellished claims.

Highlight features and benefits: Detail the tangible features and inherent benefits that make the product valuable to consumers rather than just dry facts and specifications. Connect how attributes and capabilities satisfy wants and needs. This helps visitors visualize what the product can do for them once purchased.

Target specific customer needs: Beyond general advantages, truly compelling descriptions address the needs of specific customer segments. Call out how certain features cater to types of users like beginners or experts, casual or performance-focused, etc. Precision relevance drives conversions.

Use storytelling and emotional triggers: Incorporate narrative-style copywriting that tells a compelling product story. Emphasize how quality, innovation and even inspiration make it worthwhile. Emotional triggers related to enjoyment, convenience or productivity also connect with buyers.

Call to action within the description: The description itself should direct further actions to drive conversion events. Embedding calls-to-action to add to cart or checkout capitalizes on user attention during the research phase.

Unique selling proposition (USP): Convey what makes the item and the brand behind it genuinely unique. Bring any proprietary technologies, exclusive capabilities and signature elements to the forefront. Separating on USPs increases perceived value.

3. Trustworthy Customer Reviews

Encourage and incentivize reviews: Prompt satisfied customers to submit reviews through email and on-site messaging. Offer small incentives for taking the time to provide feedback. This continually generates fresh user-generated content.

Moderate and respond to reviews: Actively moderate and manage reviews to filter non-genuine contributions. Also directly respond to negative reviews constructively to address concerns. This builds trust and transparency.

Showcase positive reviews prominently: Make stellar reviews visible in prime locations above the fold. Pull out brief key quotes that convey exclusivity and social proof to influence visitors still evaluating items.

Address negative reviews constructively: Legitimate negative commentary should never be deleted. Respond politely and offer solutions reflecting product improvements or alternative options to suit individual needs. This develops rapport.

4. Variations and Options

Display color, size, and other variations clearly: Visually demonstrate the specific color, size, style or other standout variations available for the product. Images are ideal but labels, bullets or swatches also work. Prominently showcase what customization exists.

Use clear dropdowns and navigation: Select boxes, toggles and expanding/contracting UI elements should allow effortlessly picking variations. Optimized navigation puts options seconds away with minimal clicks. Descriptive triggers tell what selection is made.

Highlight availability and stock levels: Couple variation choices with clear inventory statuses per option. Flags for low-stock or out-of-stock options, stock countdowns and estimated delivery times set proper expectations before adding items to the cart.

Offer customization options: Provide secondary tiers of customization where possible – monogramming and engraving services, build your own configurations, personalized styling advice and design templates bring unique tailoring. This perceived exclusivity lifts conversion potential.

5. Competitive Pricing and Offers

Research competitor pricing: Analyze pricing across comparable items from leading competitors. Factor in sales, coupons and loyalty discounts commonly offered. This intelligence should inform price-setting strategies.

Offer competitive prices or unique value propositions: Match prices against similar products targeting the same buyer needs. Alternatively, higher prices can be justified through messaging around exclusives, quality advantages or premium brand factors.

Highlight discounts, promotions, and bundles: Temporarily reduce prices by highlighting sales discounts or sitewide promotions to incentivize buying. Product bundle offers and bulk pricing deals encourage larger order values.

Use clear pricing information and currency conversion: Avoid hidden costs or surprise fees that only get revealed at checkout. Transparently display pricing per unit. Auto-convert currencies based on location. Guarantees should back value claims.

Implementing dynamic pricing can help adjust prices based on competitor pricing, demand fluctuations, inventory levels etc. to maximize revenue. This should be done carefully to avoid negatively impacting customer perception.

6. Clear Shipping and Return Policies

Transparent shipping costs and timelines: Specify all shipping and handling fees upfront in the shopping cart process rather than surprising customers at checkout. Provide delivery date ranges per shipping method. Real-time postal rate calculators streamline estimates.

Easy-to-understand return policy: Detail return, exchange and refund terms and conditions clearly on all product pages, allowing shoppers to make informed decisions. Call out durations, required conditions and any limitations prominently early on.

Offer free shipping or competitive options: Incentivize conversion milestones around order sizes with conditional free shipping. Absorbing shipping fees entirely boosts smaller-margin sales. Undercut common charges to lower buyer barriers.

Highlight guarantees and warranty information: Clearly advertise after-sale protections for customers regarding defects, delivery, price matches, etc. Extending guarantees drives trust in both products and merchants.

7. Mobile-Friendly Design

Responsive design for all devices: Product pages dynamically adapt layouts and elements to maintain usability across mobiles, tablets and desktops without horizontal scrolling or pinching/zooming. Flexible containers and grids reflow content.

Fast loading speed: Lightweight page architecture and streamlined visual assets enable quick loading times even on 3G/4G connections. This allows easily discovering products on the go without delays.

Easy navigation and checkout on mobile: Tap targets, input types and page flows are tailored to touch inputs for simplified navigation flows. Key actions link easily to optimized checkout and payment on small screens.

Optimize images for mobile viewing: Scale down larger product images or serve responsive picture variants to cut page weight. Carousels and videos switch to responsive ratios. Image optimization prevents rendering issues.

Advanced Features for Enhanced Conversions

  • Live chat support: Implement live chat widgets and messaging interfaces directly on product pages. This grants visitors instant access to customer service teams for any pre-purchase questions. Proactively chat to guide product research stages. Qualified support builds trust to progress sales. Chat transcript integrations also aid future optimizations.
  • Product videos and demonstrations: Embed short format video demos to showcase products elegantly in motion and real-life use. Shoppable video pins call to actions to add items featured right within videos themselves. Expert demonstrations, user testimonials and interactive 3D models bridge the experience gap vs static images.
  • Virtual try-on experiences (AR/VR): Emerging augmented and virtual reality bring lifelike trial simulation directly through browsers and apps by overlaying products onto real bodies and environments. Virtual dressing rooms let shoppers digitally try glasses, makeup, accessories. 3D product visualization in ambient scenes shape purchase decisions.
  • Wishlists and comparison tools: Wish lists allow visitors to shortlist products across sessions before committing to purchase. Shared wish lists also facilitate gifting. Comparison tools let customers contrast up to four products across specs and attributes to determine which item best fits needs. This drives conversion confidence.
  • Upselling and cross-selling recommendations: Algorithmic merchandising widgets showcase related and complementary products tailored to the currently viewed item. Targeted upsell and cross-sell suggestions increase order values. Links also route to category and search pages to extend site exploration.

FAQs on eCommerce Product Page

1. How often should I update my product pages?

Product pages should be evaluated for freshness quarterly at a minimum. Descriptions, images, pricing and promotions can be updated monthly to reflect new inventory and offers. Pages with heavy traffic and recent optimizations may need to be reviewed weekly initially.

2. How can I track the performance of my product pages?

Monitor key metrics like lead rate, average session duration, bounce rates, and source traffic channels in web analytics platforms. Compare product-level conversion funnel performance to expose areas for refinement.

3. What are some common mistakes to avoid on product pages?

Limit the use of over generic stock images that fail to represent actual products accurately. Eliminate unnecessary text content that distracts from the core details. Keep design and navigation focused solely on enabling purchases.

Conclusion

To build high-converting product pages, it’s wise to hire an experienced ecommerce developer. They can expertly optimize page design, content and functionality to boost sales. Don’t leave your product page strategy to chance – engage proven ecommerce talent today!

Optimized product pages are the lifeblood of ecommerce success, directly shaping conversion rates and revenue extraction for online stores. By focusing product detail pages specifically around driving user actions through highly relevant, engaging and inspirational information, merchants can realize tremendous gains.

Ensuring product offerings are presented completely and transparently builds essential customer trust. The product itself needs to be showcased from all angles to reinforce value. Targeted descriptions, dynamic imagery, intelligent personalization and seamless mobile experience collectively enable visitors to confidently purchase.

Continuous experimentation through A/B testing and multivariate optimization further refine product page layouts and content for improved results over time. As new features, customization options and expanded product ranges get introduced, detail pages remain the critical touchpoint for transactions. Keeping pages aligned to business objectives fuels sustainable growth and leadership.

Featured Image by Scott Graham on Unsplash

The post Key Features You Must Have in Your E-commerce Product Pages appeared first on noupe.

Categories: Others Tags:

5 Things Customers Expect from Strong Customer Service 

February 29th, 2024 No comments

Meeting customers’ expectations is a challenge for any organization. Business can drag down their revenue and waste their resource if they aren’t able to predict customer expectations. Over time, customer expectations keep on changing, exactly the way fashion trends change.

Have you ever thought about whether your organization has been able to meet all your customer’s expectations? Do you know what your customers expect from you? 

Perhaps answers to all these questions will be covered in this post.

In this blog, we will discuss the meaning of customer expectations, their types, and how to ensure customer satisfaction.

What Are Customer Expectations?

In simple terms, customer expectation means “the customer desires or predictions related to any product or service in their mind.” The expectations customers set are usually based on their previous experience, cultural norms, and social influences. It differs from individual to individual.

Before deciding to purchase a product, any individual will gather information regarding the product and gain insights about the product’s quality. The expectation of the customer often decides their decision to purchase the product or service.

The other factor that may highly affect customer purchase decisions is peer groups. For example, If a friend recommends a product, then an individual is more likely to have high expectations of the product.

Several Factors Influence Customer Expectations

There are a multitude of factors influencing customer expectations towards a product or a service. Some of the factors that significantly contribute to developing customer expectations are as follows:

  1. Product or Service Quality

Quality is the core factor in both the product and service sectors. Quality is determined by the product’s performance, durability, design, features included, etc. These quality metrics add value to the product. 

A product needs to have all these quality metrics to satisfy customers. It’s because customers, after analyzing the product or service on various metrics, finally set an expectation and decide to purchase a particular product. 

For example, if you have purchased a new laptop from a particular brand and found it extremely slow, you will never purchase it again from the same brand.

  1. Brand Reputation

Brand reputation is the reputation of the brand in people’s minds, which is generated through past interactions with the brand or through the opinions of others. 

The reputation of a brand is shaped by its consistency over time, its social responsibility, and its ranking in the industry. It is also shaped by the endorsements and partnerships that the brand has developed over time. 

Brands that are known for offering excellent service have better brand reputations than others.

  1. Price

Price plays a significant role in determining the purchasing decision of the individual. Customers have higher expectations for the brands that have higher prices. They expect the brand to have the best quality product with many features and provide a premium feeling overall. 

Likewise, if the competitor offers a lower price for the same product, then the customer expects to have a similar quality for a low price, leading to pressure on businesses. 

The business also implements psychological pricing strategies such as odd pricing (e.g., $1,999) and tiered pricing (e.g., basic,  standard) that develop certain expectations towards the brand.

For example, an expensive BMW car is expected to have better features than an average Hyundai.

  1. Speed of Delivery

Customer expectations on speed delivery depend upon the brand category. Companies that offer customized products are generally perceived to take longer delivery time. 

Similarly, during the festive seasons, the customer expects the speed of delivery time to become slow. Another factor that largely affects the speed of delivery is location. If the location between a customer and delivery units is large, the customer will expect the brand to deliver late.

However, platforms such as Amazon and Alibaba have raised delivery standards by offering faster delivery services, so organizations with similar services are expected to have faster delivery times. 

  1. Value of money

The value of money is mostly created through the level of satisfaction that a product can offer. The higher the price, the higher the perceived value, and vice versa.

Peers’ recommendations and online customer reviews can influence the perception of value. Likewise, customers compare similar products offered by different brands in terms of price and features before deciding which one to buy. 

Top 5 Types of Customer Expectations

Every business goal is to match customer expectations since it determines their sales. Customers have various expectations of brands; among them, some of the identifiable expectations are as follows:

  1. Explicit Expectations

Explicit expectations are the basic expectations that customers have before purchasing a product. Such expectations include aspects such as price, quality, delivery time, and more. These expectations are usually directly communicated and are clear and specific. 

For example, if a customer has to purchase a phone, then they may come to your shop and ask for a phone with specific features and within a certain price range.

  1. Implicit Expectations

Implicit expectations are the assumptions that a customer has about a product or a service based on other brands that sell similar products or services. These expectations are not directly communicated but may be subconscious and will influence customer purchasing behavior. 

For example, a customer always expects a hotel room to be clean and fancy.

  1. Interpersonal Expectations

Interpersonal expectations mean the expectations that a customer has while having interactions between the customer and your team members. These interactions are expected to be friendly, helpful, attentive, professional, and empathic, irrespective of how they occur, either via phone, live chat, or in person.

For example, companies can provide better interpersonal expectations for their prospects by including a creative voicemail greeting on their voicemail messages.

  1. Digital Expectations

These are expectations of the customers they have when interacting with agents through digital platforms such as websites, emails, social media, etc. It also includes engaging and relevant content. Usually, customers expect interaction through these platforms to be user-friendly, seamless, and responsive.

  1. Dynamic Performance Expectations

It refers to the change in the customer’s expectation of a product or service with time. Here, the customer expects your product performance to be more user-friendly, flexible, and adaptable with time to meet the customer’s expectations. 

Likewise, the expectation is also based on evolving the product or service with the emerging market opportunities and challenges.

Customer Expectations to Ensure Customer Satisfaction

Customer satisfaction is the outcome of fulfilling customer expectations. Therefore, it is necessary to be aware of the expectations of customers and make strategies accordingly.

Some ways to meet customer expectations are:

  1. Find Out What Your Customers Want

It is a challenging task for brands to recognize the exact expectations of individuals. So, why not ask directly? One can conduct a survey through Google Forms, Jotform Survey Maker or social media to know customer’s needs.

Likewise, they can listen to customer feedback and analyze purchasing patterns, which can bring insights into what customers want.

  1. Determine How Important Each Expectation Is

Since there are a lot of expectations, not all expectations need to be prioritized. You should prioritize them based on their importance. Select the most practical and significant expectation and work on it to bring it into reality to ensure customer satisfaction.

  1. Be Transparent

A transparent business can easily build the trust and confidence of customers. Being transparent means providing clear and true information about products, prices, terms, conditions, and delivery times.  Through transparency, one can develop a positive relationship between the customer and the business, resulting in customer satisfaction.

  1. Provide a Consistent Experience

Consistency helps in meeting customer satisfaction. Customers expect consistent experience in all the services provided by the businesses. A consistent experience develops trust, which will ultimately enhance customer retention.

  1. Handle Complaints Quickly and Politely.

Businesses must handle customer concerns immediately to retain customer satisfaction. You must ensure that you have an efficient and capable staff to handle customers’ complaints in a timely and polite manner. By addressing the complaints responsively, the brand can turn negative experiences into positive ones.

Conclusion

In conclusion, understanding customer expectations is the key to ensuring customer satisfaction. To meet customer satisfaction, businesses must match these five expectations: implicit, explicit, interpersonal, digital, and dynamic performance.

Also, by knowing what customers want, the business can prioritize activities and handle complaints efficiently while being transparent and consistent. 

With the points covered in this post, you can easily turn your customer expectations into reality and ultimately ensure customer satisfaction.

Featured Image by Patrick Tomasso on Unsplash

The post 5 Things Customers Expect from Strong Customer Service  appeared first on noupe.

Categories: Others Tags:

Waiting For Spring (March 2024 Wallpapers Edition)

February 29th, 2024 No comments

March is here! With the days getting noticeably longer in the northern hemisphere, the sun coming out, and the flowers blooming, we are fueled with fresh energy. And even if spring is far away in your part of the world, you might feel that 2024 has gained full speed by now — the perfect opportunity to bring all those plans you made and ideas you’ve been carrying around to life!

To cater for some extra inspiration this March, artists and designers from across the globe once again challenged their creative skills and designed wallpapers for your desktop and mobile screens. They come in versions with and without a calendar for March 2024 and can be downloaded for free — a monthly tradition that has been going on here at Smashing Magazine for more than twelve years already.

As a little bonus goodie, we also added some March favorites from our wallpapers archives to the collection. Maybe you’ll spot one of your almost-forgotten favorites from the past in here, too? Thank you to everyone who shared their wallpapers with us this month! This post wouldn’t exist without you.

  • You can click on every image to see a larger preview,
  • We respect and carefully consider the ideas and motivation behind each and every artist’s work. This is why we give all artists the full freedom to explore their creativity and express emotions and experience through their works. This is also why the themes of the wallpapers weren’t anyhow influenced by us but rather designed from scratch by the artists themselves.
  • Submit a wallpaper!
    Did you know that you could get featured in our next wallpapers post, too? We are always looking for creative talent.

Breaking Superstitions

“Step into a world of delightful rebellion with our calendar feature for National Open an Umbrella Indoors Day. This vibrant illustration captures the spirit of breaking free from superstitions.” — Designed by PopArt Studio from Serbia.

Fresh Flow

“It’s time for the water to go down the mountains, it’s time for the rivers to get rid of ice blocks, it’s time for the ground to feed the plants, it’s time to go out and take a deep breath. I imagined these ideas with interlacing colored lines.” — Designed by Philippe Brouard from France.

Music From The Past

Designed by Ricardo Gimenes from Sweden.

Pika Pika Chu

Designed by Design Studio from India.

Hat’s Off to Good Fortune

“Flipping the switch on luck in 2024 with a tip of the hat! Here’s to welcoming good fortune, warmth, and endless smiles.” — Designed by HeyClipart from Greece.

Northern Lights

“Spring is getting closer, and we are waiting for it with open arms. This month, we want to enjoy discovering the northern lights. To do so, we are going to Alaska, where we have the faithful company of our friend White Fang.” — Designed by Veronica Valenzuela Jimenez from Spain.

Zombie’s Happy Hour

Designed by Ricardo Gimenes from Sweden.

Time To Wake Up

“Rays of sunlight had cracked into the bear’s cave. He slowly opened one eye and caught a glimpse of nature in blossom. Is it spring already? Oh, but he is so sleepy. He doesn’t want to wake up, not just yet. So he continues dreaming about those sweet sluggish days while everything around him is blooming.” — Designed by PopArt Studio from Serbia.

Queen Bee

“Spring is coming! Birds are singing, flowers are blooming, bees are flying… Enjoy this month!” — Designed by Melissa Bogemans from Belgium.

Spring Is Coming

“This March, our calendar design epitomizes the heralds of spring. Soon enough, you’ll be waking up to the singing of swallows, in a room full of sunshine, filled with the empowering smell of daffodil, the first springtime flowers. Spring is the time of rebirth and new beginnings, creativity and inspiration, self-awareness, and inner reflection. Have a budding, thriving spring!” — Designed by PopArt Studio from Serbia.

Botanica

Designed by Vlad Gerasimov from Georgia.

Fresh Lemons

Designed by Nathalie Ouederni from France.

Let’s Spring

“After some freezing months, it’s time to enjoy the sun and flowers. It’s party time, colours are coming, so let’s spring!” — Designed by Colorsfera from Spain.

March For Equality

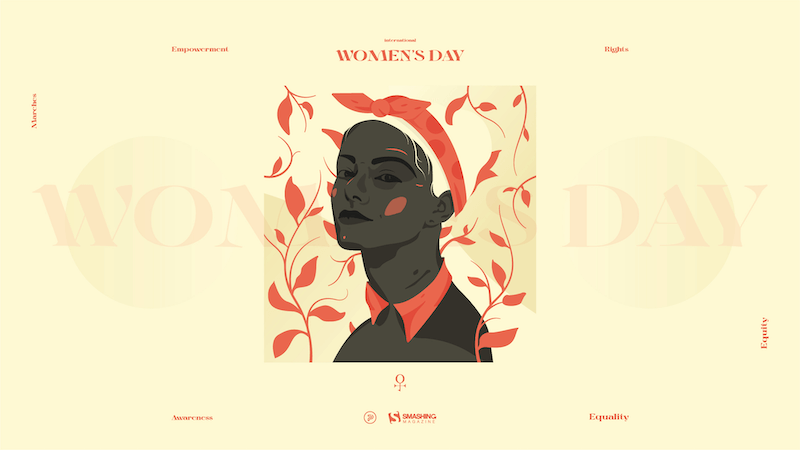
“This March, we shine the spotlight on International Women’s Day, reflecting on the achieved and highlighting the necessity for a more equal and understanding world. These turbulent times that we are in require us to stand together unitedly and IWD aims to do that.” — Designed by PopArt Studio from Serbia.

Spring Bird

Designed by Nathalie Ouederni from France.

Awakening

“I am the kind of person who prefers the cold but I do love spring since it’s the magical time when flowers and trees come back to life and fill the landscape with beautiful colors.” — Designed by Maria Keller from Mexico.

Let’s Get Outside

Designed by Lívia Lénárt from Hungary.

Waiting For Spring

“As days are getting longer again and the first few flowers start to bloom, we are all waiting for spring to finally arrive.” — Designed by Naioo from Germany.

Ballet

“A day, even a whole month, isn’t enough to show how much a woman should be appreciated. Dear ladies, any day or month are yours if you decide so.” — Designed by Ana Masnikosa from Belgrade, Serbia.

MARCHing Forward

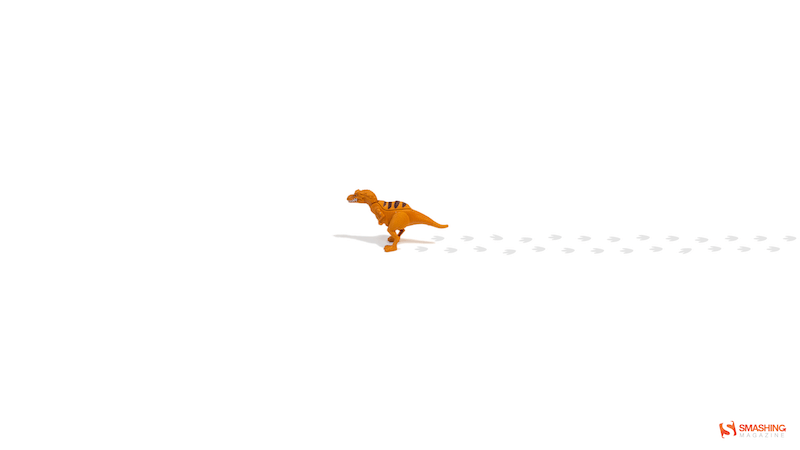
“If all you want is a little orange dinosaur MARCHing (okay, I think you get the pun) across your monitor, this wallpaper was made just for you! This little guy is my design buddy at the office and sits by (and sometimes on top of) my monitor. This is what happens when you have designer’s block and a DSLR.” — Designed by Paul Bupe Jr from Statesboro, GA.

Nothing To Do

Designed by Ricardo Gimenes from Sweden.

Orion’s Apple

Designed by Monia Gabhi from Canada.

St. Patrick’s Day

“On the 17th March, raise a glass and toast St. Patrick on St. Patrick’s Day, the Patron Saint of Ireland.” — Designed by Ever Increasing Circles from the United Kingdom.

Questions

“Doodles are slowly becoming my trademark, so I just had to use them to express this phrase I’m fond of recently. A bit enigmatic, philosophical. Inspiring, isn’t it?” — Designed by Marta Paderewska from Poland.

Explore The Forest

“This month, I want to go to the woods and explore my new world in sunny weather.” — Designed by Zi-Cing Hong from Taiwan.

The Great Beyond

“My inspiration came mostly from ‘The Greay from’. It’s about a dog and an astronaut exploring a strange new world.” — Designed by Lars Pauwels from Belgium.

Happy Birthday Dr. Seuss!

“March the 2nd marks the birthday of the most creative and extraordinary author ever, Dr. Seuss! I have included an inspirational quote about learning to encourage everyone to continue learning new things every day.” — Designed by Safia Begum from the United Kingdom.</p

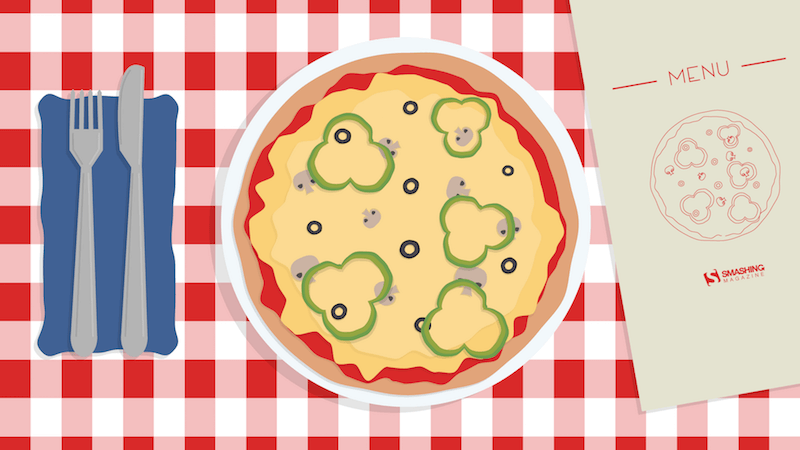
Pizza Time

“Who needs an excuse to look at pizza all month?” — Designed by James Mitchell from the United Kingdom.

Tacos To The Moon And Back

Designed by Ricardo Gimenes from Sweden.

Categories: Others Tags:

6 Best AI Productivity Apps in 2024

February 28th, 2024 No comments

There’s no escaping it: if you want to be successful, you need to be productive. The more you work, the more you progress, which for many people means long days, working evenings, and weekends. But it doesn’t have to be like that.

Categories: Designing, Others Tags:

UX Design for the Modern User: Creating Intuitive and User-Friendly Experiences

February 27th, 2024 No comments

Remember the days when clunky interfaces and confusing menus were tolerated? In 2023, with the average user encountering over 10,000 marketing messages daily, attention spans are shrinking faster than glaciers!

Users demand experiences that are intuitive, engaging, and even fun. To cut through the noise and stand out, you must be user-centric and prioritize people’s needs. 

This blog explores the key principles and latest trends that shape your UX design process in the modern age. Dive in to unlock the secrets of UX design for the modern user.

What is user experience (UX) design? 

UX design, or user experience design, creates an intuitive and satisfying experience, guiding users through your product with ease and delight. It’s like paving a clear path that turns using technology into a joy, not a struggle.

UI vs. UX design

Image with different points highlighting difference between UI vs UX design.

(Image source)

UI (User Interface design) is the LOOK and FEEL of a product, like the buttons and screens you interact with.

UX (User Experience design) is the ENTIRE journey with a product, from how easy it is to use to how it makes you feel.

What does the modern user demand?

In today’s digital landscape, users come in all shapes and sizes, from tech-savvy teens glued to their phones to grandparents mastering video calls. But one thing unites them: the search for a great user experience. 

Delivering it isn’t as easy as it seems. Each user is an individual, and so is each digital experience. Combine user personalization with the enormity of the Internet itself, and you begin to see the challenge of meeting user expectations.

Several factors drive this “butterfly effect”:

  • Data deluge: We’re drowning in information, making it crucial for content to be clear, concise, and visually appealing. After all, who has time for dense text walls in this fast-paced world?
  • The mobile revolution: The world is literally in our pockets now, with smartphones serving as gateways to information, entertainment, and endless connections.
  • Information overload: We’re bombarded with notifications, emails, and messages, pulling our focus in a million directions.

This is where data analytics tools come in. These powerful tools not only help crunch numbers but also understand modern users. By collecting, analyzing, and interpreting data, UX designers can gain valuable insights into:

  • User behavior: How do users interact with products and services? What are their pain points and frustrations?
  • User needs: What problems are users trying to solve? What are their unmet needs?
  • User preferences: What do users like and dislike? What features are most used?
  • User feedback: How are users reacting to new features or changes?

This data helps user experience designers make informed decisions about product development, creating intuitive and user-friendly experiences that meet users’ expectations and needs.

Key principles of UX design for the modern user

Here are some essential UX design principles that can help you craft a positive and engaging user experience for modern users in 2024:

1. User-focused

88% of website visitors leave a site because of a bad user experience. Understand your users’ pain points, behaviors, and expectations. Conduct user research and A/B testing to refine your designs and ensure they solve real problems, not create new ones.

2. Mobile-first

According to Statcounter, 57.87% of global web traffic originated from mobile apps in 2023. Prioritize responsive designs that adapt seamlessly to different screen sizes and interactions. 

3. Intuitive navigation

42% of people would leave a website because of poor functionality. Use clear labels, logical page hierarchies, and familiar design patterns like breadcrumbs and progress bars to make navigation effortless.

4. Minimalism and clarity

Avoid clutter and information overload. Prioritize the most important content, use whitespace effectively, and leverage visual cues like icons and illustrations to guide users without bombarding them.

5. Accessibility and inclusion

Use clear language, high contrast ratios, alternative input methods like keyboard navigation, and screen reader compatibility to ensure everyone has an equal and positive experience.

Recommend: Is your Website Accessible? It Should Be.

UX design trends for the modern user in 2024

By prioritizing user needs, leveraging cutting-edge tech, and championing accessibility, you can create UX design for modern users. Here are 5 design trends to watch in 2024:

1. Voice interface

Role of Voice interface in UX design for modern users

(Image source)

Statista predicts that 8 billion voice assistants will be in use by 2024. This rise demands intuitive voice commands and Natural Language Understanding (NLU). UX designers must master conversational design, creating flows that feel like friendly chat, not robotic interactions.

2. Personalization and customization

Users crave experiences tailored to their unique needs and preferences. Dynamic content, intuitive interfaces, and AI-powered recommendations are key. Think beyond the Netflix model – personalize everything from product recommendations to learning paths.

A 2023 study by McKinsey found that 71% of consumers expect personalization, and 76% get frustrated when this doesn’t happen.

Artificial intelligence (AI) tools like Framer, Jasper, and Adobe Sensei help give designers an edge. They streamline workflows while improving personalization for ?users — double-check.

3. Micro-animation and motion graphics

Elegant animations of buttons, progress bars, and transitions inject life and responsiveness into user interfaces. Every click should be a mini-celebration.

Also, adding visual elements like motion graphics will help website visitors stay longer and engage more.

4. Immersive experiences

How 3D image helps create immersive UX design experiences.

(Image source)

VR/AR integration, 3D elements, and haptics (think vibration controllers) are blurring the lines between digital and real-world experiences. Imagine users not just looking at your app but stepping into it.

The global Virtual Reality (VR) market is projected to reach $58.61 billion by 2024, showcasing the immense potential of immersive experiences.

5. Data-driven design

A/B testing, user research, and analytics should inform every design decision. Optimize for user behavior, not just aesthetics. Data is the compass that guides your design decisions, ensuring you’re creating experiences that truly resonate.

Closing thoughts

We’ve explored the ever-evolving landscape of UX design, where user-centricity reigns supreme. We’ve unpacked the key principles that guide our digital interactions and the exciting trends shaping the future of the user experience design process. 

Remember, the modern user expects experiences that are intuitive, delightful, and accessible. So, embrace the challenge and let curiosity be your compass. Stay informed, experiment fearlessly, and never lose sight of the human at the heart of every interaction.
For constant inspiration and cutting-edge design knowledge, dive into the vibrant design community at Noupe. We’re passionate about pushing boundaries and helping you and your design team create experiences that matter. Join us – let’s design tomorrow, today!

Featured Image by Kelly Sikkema on Unsplash

The post UX Design for the Modern User: Creating Intuitive and User-Friendly Experiences appeared first on noupe.

Categories: Others Tags:

Reporting Core Web Vitals With The Performance API

February 27th, 2024 No comments

This article is a sponsored by DebugBear

There’s quite a buzz in the performance community with the Interaction to Next Paint (INP) metric becoming an official Core Web Vitals (CWV) metric in a few short weeks. If you haven’t heard, INP is replacing the First Input Delay (FID) metric, something you can read all about here on Smashing Magazine as a guide to prepare for the change.

But that’s not what I really want to talk about. With performance at the forefront of my mind, I decided to head over to MDN for a fresh look at the Performance API. We can use it to report the load time of elements on the page, even going so far as to report on Core Web Vitals metrics in real time. Let’s look at a few ways we can use the API to report some CWV metrics.

Browser Support Warning

Before we get started, a quick word about browser support. The Performance API is huge in that it contains a lot of different interfaces, properties, and methods. While the majority of it is supported by all major browsers, Chromium-based browsers are the only ones that support all of the CWV properties. The only other is Firefox, which supports the First Contentful Paint (FCP) and Largest Contentful Paint (LCP) API properties.

So, we’re looking at a feature of features, as it were, where some are well-established, and others are still in the experimental phase. But as far as Core Web Vitals go, we’re going to want to work in Chrome for the most part as we go along.

First, We Need Data Access

There are two main ways to retrieve the performance metrics we care about:

  1. Using the performance.getEntries() method, or
  2. Using a PerformanceObserver instance.

Using a PerformanceObserver instance offers a few important advantages:

  • PerformanceObserver observes performance metrics and dispatches them over time. Instead, using performance.getEntries() will always return the entire list of entries since the performance metrics started being recorded.
  • PerformanceObserver dispatches the metrics asynchronously, which means they don’t have to block what the browser is doing.
  • The element performance metric type doesn’t work with the performance.getEntries() method anyway.

That all said, let’s create a PerformanceObserver:

const lcpObserver = new PerformanceObserver(list => {});

For now, we’re passing an empty callback function to the PerformanceObserver constructor. Later on, we’ll change it so that it actually does something with the observed performance metrics. For now, let’s start observing:

lcpObserver.observe({ type: "largest-contentful-paint", buffered: true });

The first very important thing in that snippet is the buffered: true property. Setting this to true means that we not only get to observe performance metrics being dispatched after we start observing, but we also want to get the performance metrics that were queued by the browser before we started observing.

The second very important thing to note is that we’re working with the largest-contentful-paint property. That’s what’s cool about the Performance API: it can be used to measure very specific things but also supports properties that are mapped directly to CWV metrics. We’ll start with the LCP metric before looking at other CWV metrics.

Reporting The Largest Contentful Paint

The largest-contentful-paint property looks at everything on the page, identifying the biggest piece of content on the initial view and how long it takes to load. In other words, we’re observing the full page load and getting stats on the largest piece of content rendered in view.

We already have our Performance Observer and callback:

const lcpObserver = new PerformanceObserver(list => {});
lcpObserver.observe({ type: "largest-contentful-paint", buffered: true });

Let’s fill in that empty callback so that it returns a list of entries once performance measurement starts:

// The Performance Observer
const lcpObserver = new PerformanceObserver(list => {
  // Returns the entire list of entries
  const entries = list.getEntries();
});

// Call the Observer
lcpObserver.observe({ type: "largest-contentful-paint", buffered: true });

Next, we want to know which element is pegged as the LCP. It’s worth noting that the element representing the LCP is always the last element in the ordered list of entries. So, we can look at the list of returned entries and return the last one:

// The Performance Observer
const lcpObserver = new PerformanceObserver(list => {
  // Returns the entire list of entries
  const entries = list.getEntries();
  // The element representing the LCP
  const el = entries[entries.length - 1];
});

// Call the Observer
lcpObserver.observe({ type: "largest-contentful-paint", buffered: true });

The last thing is to display the results! We could create some sort of dashboard UI that consumes all the data and renders it in an aesthetically pleasing way. Let’s simply log the results to the console rather than switch gears.

// The Performance Observer
const lcpObserver = new PerformanceObserver(list => {
  // Returns the entire list of entries
  const entries = list.getEntries();
  // The element representing the LCP
  const el = entries[entries.length - 1];

  // Log the results in the console
  console.log(el.element);
});

// Call the Observer
lcpObserver.observe({ type: "largest-contentful-paint", buffered: true });

There we go!

It’s certainly nice knowing which element is the largest. But I’d like to know more about it, say, how long it took for the LCP to render:

// The Performance Observer
const lcpObserver = new PerformanceObserver(list => {

  const entries = list.getEntries();
  const lcp = entries[entries.length - 1];

  entries.forEach(entry => {
    // Log the results in the console
    console.log(
      The LCP is:,
      lcp.element,
      The time to render was ${entry.startTime} milliseconds.,
    );
  });
});

// Call the Observer
lcpObserver.observe({ type: "largest-contentful-paint", buffered: true });

// The LCP is:
// <h2 class="author-post__title mt-5 text-5xl">…</h2>
// The time to  render was 832.6999999880791 milliseconds.

Reporting First Contentful Paint

This is all about the time it takes for the very first piece of DOM to get painted on the screen. Faster is better, of course, but the way Lighthouse reports it, a “passing” score comes in between 0 and 1.8 seconds.

Just like we set the type property to largest-contentful-paint to fetch performance data in the last section, we’re going to set a different type this time around: paint.

When we call paint, we tap into the PerformancePaintTiming interface that opens up reporting on first paint and first contentful paint.

// The Performance Observer
const paintObserver = new PerformanceObserver(list => {
  const entries = list.getEntries();
  entries.forEach(entry => {
// Log the results in the console. console.log( The time to ${entry.name} took ${entry.startTime} milliseconds., ); }); }); // Call the Observer. paintObserver.observe({ type: "paint", buffered: true }); // The time to first-paint took 509.29999999981374 milliseconds. // The time to first-contentful-paint took 509.29999999981374 milliseconds.

Notice how paint spits out two results: one for the first-paint and the other for the first-contenful-paint. I know that a lot happens between the time a user navigates to a page and stuff starts painting, but I didn’t know there was a difference between these two metrics.

Here’s how the spec explains it:

“The primary difference between the two metrics is that [First Paint] marks the first time the browser renders anything for a given document. By contrast, [First Contentful Paint] marks the time when the browser renders the first bit of image or text content from the DOM.”

As it turns out, the first paint and FCP data I got back in that last example are identical. Since first paint can be anything that prevents a blank screen, e.g., a background color, I think that the identical results mean that whatever content is first painted to the screen just so happens to also be the first contentful paint.

But there’s apparently a lot more nuance to it, as Chrome measures FCP differently based on what version of the browser is in use. Google keeps a full record of the changelog for reference, so that’s something to keep in mind when evaluating results, especially if you find yourself with different results from others on your team.

Reporting Cumulative Layout Shift

How much does the page shift around as elements are painted to it? Of course, we can get that from the Performance API! Instead of largest-contentful-paint or paint, now we’re turning to the layout-shift type.

This is where browser support is dicier than other performance metrics. The LayoutShift interface is still in “experimental” status at this time, with Chromium browsers being the sole group of supporters.

As it currently stands, LayoutShift opens up several pieces of information, including a value representing the amount of shifting, as well as the sources causing it to happen. More than that, we can tell if any user interactions took place that would affect the CLS value, such as zooming, changing browser size, or actions like keydown, pointerdown, and mousedown. This is the lastInputTime property, and there’s an accompanying hasRecentInput boolean that returns true if the lastInputTime is less than 500ms.

Got all that? We can use this to both see how much shifting takes place during page load and identify the culprits while excluding any shifts that are the result of user interactions.

const observer = new PerformanceObserver((list) => {
  let cumulativeLayoutShift = 0;
  list.getEntries().forEach((entry) => {
    // Don't count if the layout shift is a result of user interaction.
    if (!entry.hadRecentInput) {
      cumulativeLayoutShift += entry.value;
    }
    console.log({ entry, cumulativeLayoutShift });
  });
});

// Call the Observer.
observer.observe({ type: "layout-shift", buffered: true });

Given the experimental nature of this one, here’s what an entry object looks like when we query it:

Pretty handy, right? Not only are we able to see how much shifting takes place (0.128) and which element is moving around (article.a.main), but we have the exact coordinates of the element’s box from where it starts to where it ends.

Reporting Interaction To Next Paint

This is the new kid on the block that got my mind wondering about the Performance API in the first place. It’s been possible for some time now to measure INP as it transitions to replace First Input Delay as a Core Web Vitals metric in March 2024. When we’re talking about INP, we’re talking about measuring the time between a user interacting with the page and the page responding to that interaction.

We need to hook into the PerformanceEventTiming class for this one. And there’s so much we can dig into when it comes to user interactions. Think about it! There’s what type of event happened (entryType and name), when it happened (startTime), what element triggered the interaction (interactionId, experimental), and when processing the interaction starts (processingStart) and ends (processingEnd). There’s also a way to exclude interactions that can be canceled by the user (cancelable).

const observer = new PerformanceObserver((list) => {
  list.getEntries().forEach((entry) => {
    // Alias for the total duration.
    const duration = entry.duration;
    // Calculate the time before processing starts.
    const delay = entry.processingStart - entry.startTime;
    // Calculate the time to process the interaction.
    const lag = entry.processingStart - entry.startTime;

    // Don't count interactions that the user can cancel.
    if (!entry.cancelable) {
      console.log(`INP Duration: ${duration}`);
      console.log(`INP Delay: ${delay}`);
      console.log(`Event handler duration: ${lag}`);
    }
  });
});

// Call the Observer.
observer.observe({ type: "event", buffered: true });

Reporting Long Animation Frames (LoAFs)

Let’s build off that last one. We can now track INP scores on our website and break them down into specific components. But what code is actually running and causing those delays?

The Long Animation Frames API was developed to help answer that question. It won’t land in Chrome stable until mid-March 2024, but you can already use it in Chrome Canary.

A long-animation-frame entry is reported every time the browser couldn’t render page content immediately as it was busy with other processing tasks. We get an overall duration for the long frame but also a duration for different scripts involved in the processing.

const observer = new PerformanceObserver((list) => {
  list.getEntries().forEach((entry) => {
    if (entry.duration > 50) {
      // Log the overall duration of the long frame.
      console.log(Frame took ${entry.duration} ms)
      console.log(Contributing scripts:)
      // Log information on each script in a table.
      entry.scripts.forEach(script => {
        console.table({
          // URL of the script where the processing starts
          sourceURL: script.sourceURL,
          // Total time spent on this sub-task
          duration: script.duration,
          // Name of the handler function
          functionName: script.sourceFunctionName,
          // Why was the handler function called? For example, 
          // a user interaction or a fetch response arriving.
          invoker: script.invoker
        })
      })
    }
  });
});

// Call the Observer.
observer.observe({ type: "long-animation-frame", buffered: true });

When an INP interaction takes place, we can find the closest long animation frame and investigate what processing delayed the page response.

There’s A Package For This

The Performance API is so big and so powerful. We could easily spend an entire bootcamp learning all of the interfaces and what they provide. There’s network timing, navigation timing, resource timing, and plenty of custom reporting features available on top of the Core Web Vitals we’ve looked at.

If CWVs are what you’re really after, then you might consider looking into the web-vitals library to wrap around the browser Performance APIs.

Need a CWV metric? All it takes is a single function.

webVitals.getINP(function(info) {
  console.log(info)
}, { reportAllChanges: true });

Boom! That reportAllChanges property? That’s a way of saying we only want to report data every time the metric changes instead of only when the metric reaches its final value. For example, as long as the page is open, there’s always a chance that the user will encounter an even slower interaction than the current INP interaction. So, without reportAllChanges, we’d only see the INP reported when the page is closed (or when it’s hidden, e.g., if the user switches to a different browser tab).

We can also report purely on the difference between the preliminary results and the resulting changes. From the web-vitals docs:

function logDelta({ name, id, delta }) {
  console.log(`${name} matching ID ${id} changed by ${delta}`);
}

onCLS(logDelta);
onINP(logDelta);
onLCP(logDelta);

Measuring Is Fun, But Monitoring Is Better

All we’ve done here is scratch the surface of the Performance API as far as programmatically reporting Core Web Vitals metrics. It’s fun to play with things like this. There’s even a slight feeling of power in being able to tap into this information on demand.

At the end of the day, though, you’re probably just as interested in monitoring performance as you are in measuring it. We could do a deep dive and detail what a performance dashboard powered by the Performance API is like, complete with historical records that indicate changes over time. That’s ultimately the sort of thing we can build on this — we can build our own real user monitoring (RUM) tool or perhaps compare Performance API values against historical data from the Chrome User Experience Report (CrUX).

Or perhaps you want a solution right now without stitching things together. That’s what you’ll get from a paid commercial service like DebugBear. All of this is already baked right in with all the metrics, historical data, and charts you need to gain insights into the overall performance of a site over time… and in real-time, monitoring real users.

DebugBear can help you identify why users are having slow experiences on any given page. If there is slow INP, what page elements are these users interacting with? What elements often shift around on the page and cause high CLS? Is the LCP typically an image, a heading, or something else? And does the type of LCP element impact the LCP score?

To help explain INP scores, DebugBear also supports the upcoming Long Animation Frames API we looked at, allowing you to see what code is responsible for interaction delays.

The Performance API can also report a list of all resource requests on a page. DebugBear uses this information to show a request waterfall chart that tells you not just when different resources are loaded but also whether the resources were render-blocking, loaded from the cache or whether an image resource is used for the LCP element.

In this screenshot, the blue line shows the FCP, and the red line shows the LCP. We can see that the LCP happens right after the LCP image request, marked by the blue “LCP” badge, has finished.

DebugBear offers a 14-day free trial. See how fast your website is, what’s slowing it down, and how you can improve your Core Web Vitals. You’ll also get monitoring alerts, so if there’s a web vitals regression, you’ll find out before it starts impacting Google search results.

Categories: Others Tags: