20 Key Influencer Marketing Statistics to Help You Shape Your Strategy in 2023
For many marketers, an influencer marketing strategy is a no-brainer. The others are still deciding on the worth of influencer marketing.
Both are perfectly right in their own way: After all, the importance of influencer marketing “depends” on the type of industry you’re in and the kind of work you do.
However, if you’ve never dipped your toe in the world of influencer marketing but are eager to learn more, we’ve got some jaw-dropping statistics that’ll help you shape your strategy in 2023.
Please note: We’ve only noted the statistics acquired from studies conducted between 2021–2023 to ensure relevancy.
Let’s dive in.
Key statistics to shape up your influencer strategy
1. When asked to share a budget, 23% of marketers planned to spend 40% of their marketing budget on influencer marketing, whereas the average majority (25%), planned to dedicate 10–20% of their budget. (Source)
Some marketers leverage AI to cut down costs. There are tools that help to find potential candidates in a short period of time, plus writing tools can help develop guidelines and brand books to make the partnership seamless.
Tools like Klear, Chat GPT, and specialized writing tools for marketing and sales content, for instance, are some valuable resources marketing teams can leverage to save time and money. However, it is crucial to check for features and specifications in advance to choose the right toolset. For those looking in for tools in the content space, online reviews like this one on Jasper.ai vs. Copy.ai are helpful.
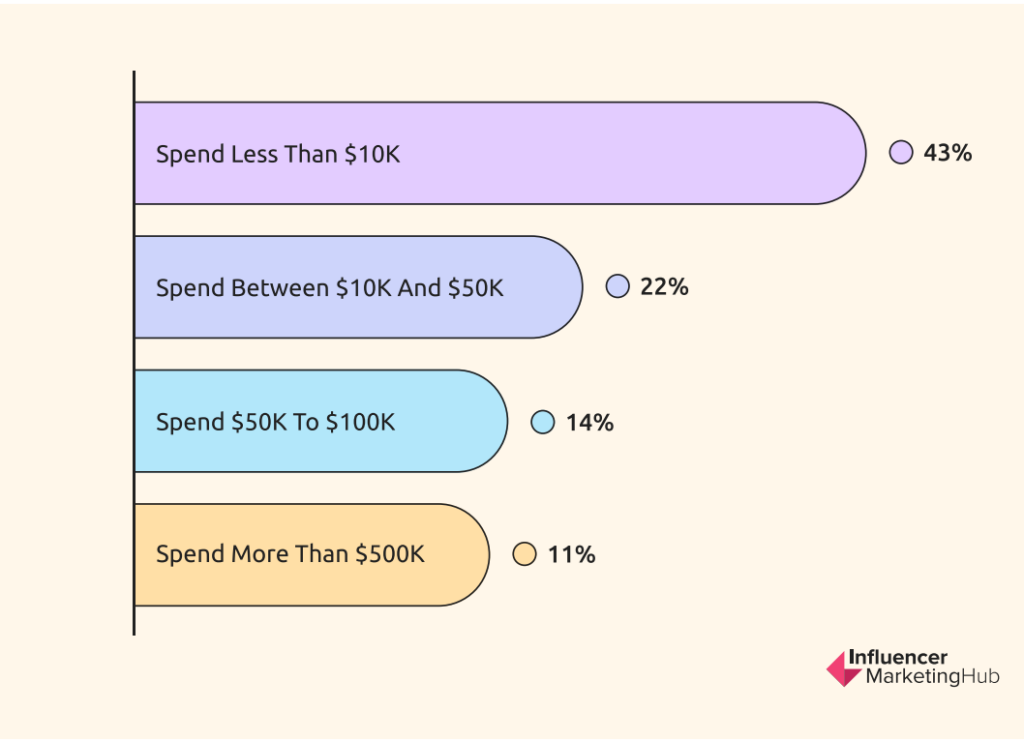
2. 43% of brands spend less than $10k/year (US Dollars) on influencer marketing. However, there are a few who spend more than $500k. (Source)

3. Instagram is the most popular channel for influencer marketing, with 87% of marketers and 90% of creators planning to increase their presence there. (Source)
4. According to a 2022 survey (whose respondents were mainly brands and PR and marketing agencies), 54% of the organizations said they worked with up to 10 influencers, and 3% said they worked with 1000+ influencers. (Source)
5. In 2023, brands plan to decrease their spending on the following platforms: Snapchat (73%), Twitter (58%), Pinterest (43%), etc. (Source)

6. Zara, Shein, and Instagram are the most talked-about brands on Instagram. (Source)
This indicates the audiences there place importance on fashion, which means if you’re in the fashion business and you sell products like leather jackets and linen suits, partnerships with creators on Instagram may be an exceptionally good strategy for you. You can get a lot of valuable data for earned media and social media mentions and utilize this data for your HubSpot lead scoring, which will help you get more conversions in the end.
7. In 2022, brands placed importance on the following metrics when partnering with influencers: engagement rates (32%), social media traffic (19%), and brand mentions (11%). (Source)
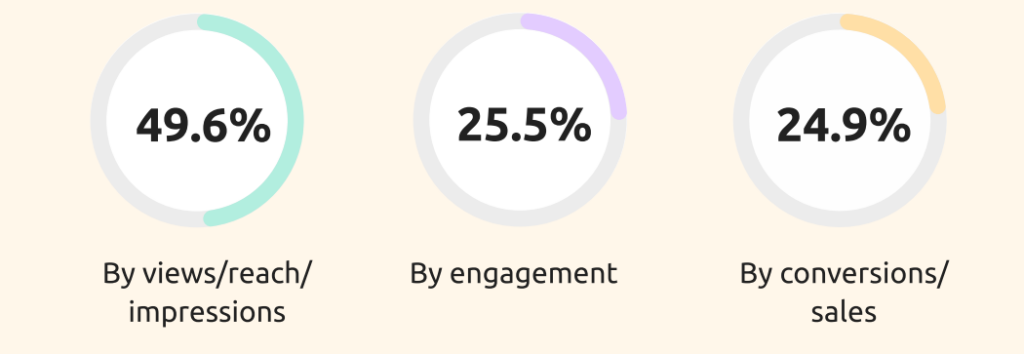
However, in 2023, the following metrics have the highest level of importance: views, reach, and impressions (49.6%), engagement (25.5%), and conversions/sales (24.9%). (Source)

8. 61% of brands prefer to work with the same influencers, whereas the remaining 39% prefer working with new influencers. (Source)
9. An average majority (77%) of influencers are female, and 23% of them are male. (Source) You’ll find a breakdown of this statistic by each platform below.

10. In 2021 and 2022
- Mega-influencers charged at least $1,200 (US dollars) per Instagram post, whereas macro-influencers charged anywhere between $185-$2500. (Source)
- On TikTok, mega-influencers charged an average minimum of $1,034, and macro-influencers charged anywhere between $151-$793. (Source)
- On YouTube, the former (mega-influencers) charged an average minimum of $2,500, and the latter (macro-influencers) charged between $1105-$16,234, thus making YouTube the platform that requires the highest amount of investment for influencer partnerships. (Source)
If your budget doesn’t allow you to partner with mega or macro influencers, you can try getting your foot in the door with organic posts instead of paid ones.
For example, if you’re in the pet industry and want to work with a cat influencer, you can offer them free products, such as toys, food, accessories, furniture, and even cat insurance. That might get you noticed (and if your luck has it, you might get a free post out of it too).
This barter strategy worked so well for Awful Cloth, it got them noticed by influencers Jason Derulo, Bryce Hall, and Charli D’Amelio.

If you get a free post or promotion, make sure to highlight it in you social media and website to use it as social proof. Create eye-catching captions to boost sales by leveraging AI writing tools, photo editors and upscale API to ensure high-quality.
11. A 2021 survey said that 53% of respondents believe influencers are the most skilled at promoting beauty products, and 45% of them said they are the most skilled at promoting clothing/accessories. (Source)
12. More than 61% of the brands plan to use artificial intelligence or machine learning to identify which influencers to work with. (Source).

13. 39% of brands prefer to work with nano-influencers, whereas 30% of them prefer to work with micro-influencers. (Source)
14. An influencer collaboration takes approximately 16 days to complete its full lifecycle. (Source)
15. Price per post for any influencer partnership is usually determined by the following formula, “Average engagement x Engagement Rate Price.”
The average engagement rate cost on YouTube is $0.04, on TikTok is $0.21, on Instagram is $0.56, on Facebook is $2.63, on Pinterest is $5.51, and on Twitter is $37.82. (Source)
Side note: Prices are in US dollars.
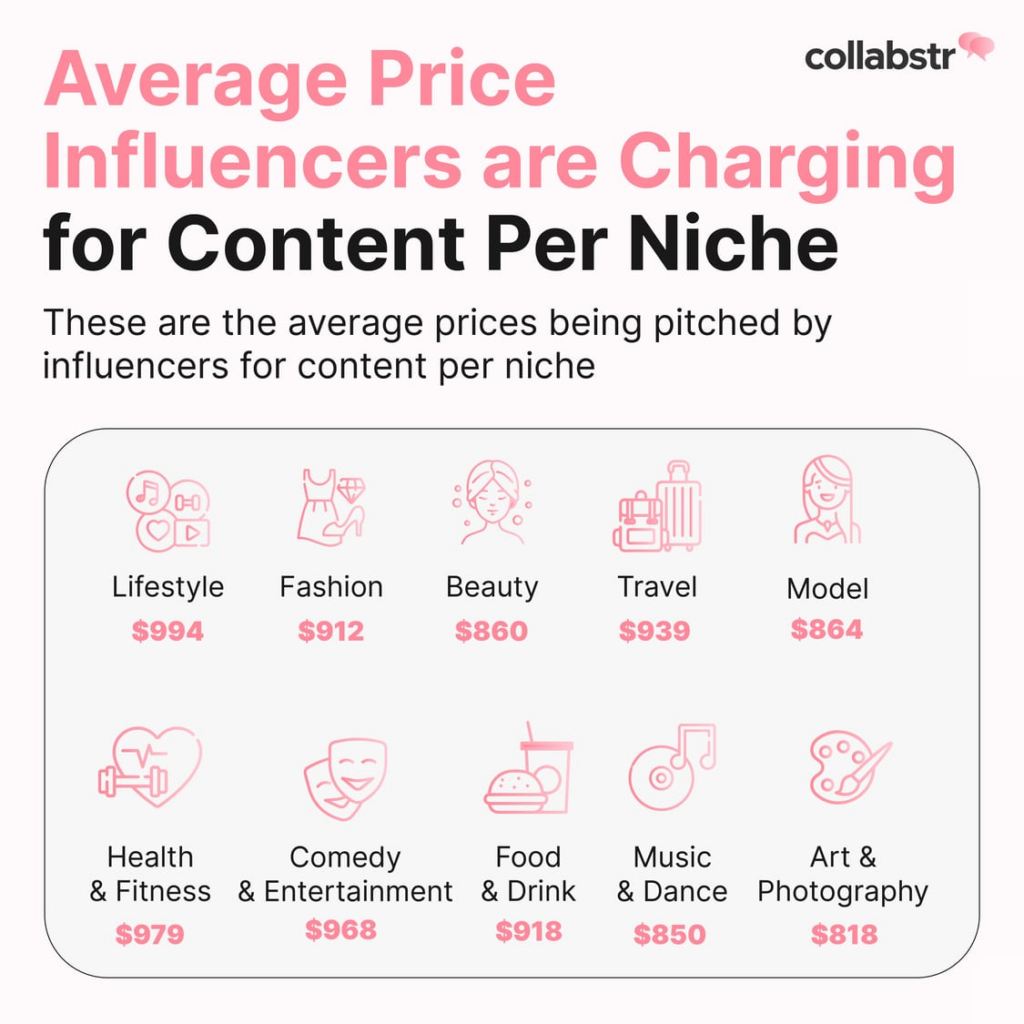
16. Lifestyle, fitness, entertainment, etc., are some of the most profitable niches for influencers. (Source)
When you take an average of how much 500,000 influencers charge across various niches on a variety of platforms, these are the figures you’ll get:

17. In 2022, these were the accounted engagement rates of influencers: Nano-influencers (2.53%), micro-influencers (1.06%), mid-tier influencers (0.91%), macro-influencers (0.86%), and mega-influencers (0.92%). (Source)
18. Between 2022 and 2023, 70% of influencers have increased their rates, 2% have decreased them, and around 28% are keeping them just the same. (Source)
19. Men prefer to follow influencers who operate in the gaming, fitness, and food niches. While women prefer to follow influencers who operate in the skincare, fashion, and food niches. (Source)
20. A study that focused on Gen Z and millennials said that these audiences prefer to follow someone who’s authentic, funny, or knowledgeable, as opposed to someone with a large following. (Source)
Learn more about influencer marketing
Since we’ve only seen the rise of influencer marketing in the past few years, there’s still a lot to learn about the industry’s future and how effective it could be in the long run.
To keep up with all the trends in influencer marketing, you can regularly follow places like Influencer Marketing Hub, Adweek, and Noupe (as we regularly post advice on improving your brand presence and marketing strategies).
So are you ready to take the leap and invest in influencer marketing? Join the thousands of brands already tapping into this lucrative marketing strategy. You won’t regret it and neither will your bottom line.
Happy influencing!
Featured Image by rawpixel.com on Freepik
The post 20 Key Influencer Marketing Statistics to Help You Shape Your Strategy in 2023 appeared first on noupe.
